An Illustration and A Twisted Finger

Let’s illustrate in an easier way what torque and drag is:

Hold your index finger tightly in the fist of your other hand.

Now twist your finger.

Twist Your Finger and You Feel The Pain


Do you feel how your finger does not want to twist?

Yes!

You know why?

Because it's not built to be twisted.

The pain you feel is because of the torque you are putting on the joints.  - That's torque.

Do you feel how your finger resists the pull because you have a good grip on it with your fist? - That's drag.

Torque and drag can have a dramatic increase in horizontal and extended-reach wells and can become the limiting factor in determining the horizontal length or extended-reach of a well. For this reason, precise calculations of torque and drag are necessary for drilling operations. Torque and drag are the results of friction caused by a moving pipe inside the wellbore: torque occurs when rotating the pipe along the wellbore and drag occurs when moving the pipe.

When drilling horizontal or extended-reach wells, excessive torque and drag may become troublesome both in the drilling operations and later in the completion operations. Estimating torque and drag is very important, but the calculation of drag in the build section of a well is complicated by the effect of the axial force (tensile or compressive) on the lateral contact force which produces the sliding drag and in turn causes changes to the axial force itself. The axial force has a great effect on the torque and drag calculations in the build section. When the axial force (tension or compression) becomes large enough to let the pipe contact only one side of the wellbore, the torque and drag in the build section will increase proportionally with the increase in the axial force.

The most common way to calculate approximate torque and drag values in the build section involves monotonous numerical calculations: dividing the build section into many small pieces, assuming the axial force remains constant in those small pieces, calculating the friction factor for each of the pieces, and then summing these values to get the total drag over the entire build section. This process is both time-consuming and difficult for field engineers.

The analysis of torque and drag is made easier by today’s technology. There is a comprehensive torque and drag software in the market that removes many of the risks during the drilling process. This software was developed by PVI and it’s called TADPRO (Torque and Drag).

TADPRO - torque and drag

This software comes with features that help users to:

  • Calculate hookload and surface torque
  • Identify potential buckling
  • Perform sensitivity analysis
  • Determine side force
  • Analyze forces downhole
  • User-friendliness and graphical outputs

Illustrations have always been a great learning method and today we have learned two things:

  1. Fingers were not made to be twisted.
  2. Likewise a pipe is not built to be twisted, but the torque and drag inevitably occurs during horizontal drilling, but with the help of TADPRO, torque and drag can be calculated and predicted, therefore the risks are reduced.

Drilling Software: See the Invisible

We just had a T-Shirt design contest. Graphic designers were asked to put drilling software in perspective of the design.

Nowadays, drilling engineering software is an indispensable tool for drilling engineers. Directional and extended reach drilling and HTHP wells challenge us with more and more technical difficulties. Software is one of the solutions to these problems. However, because of its abstract nature, it is not easy to illustrate drilling software in a T-shirt design. At least, it is difficult to have a good design without using abused images of drilling rigs and computers.

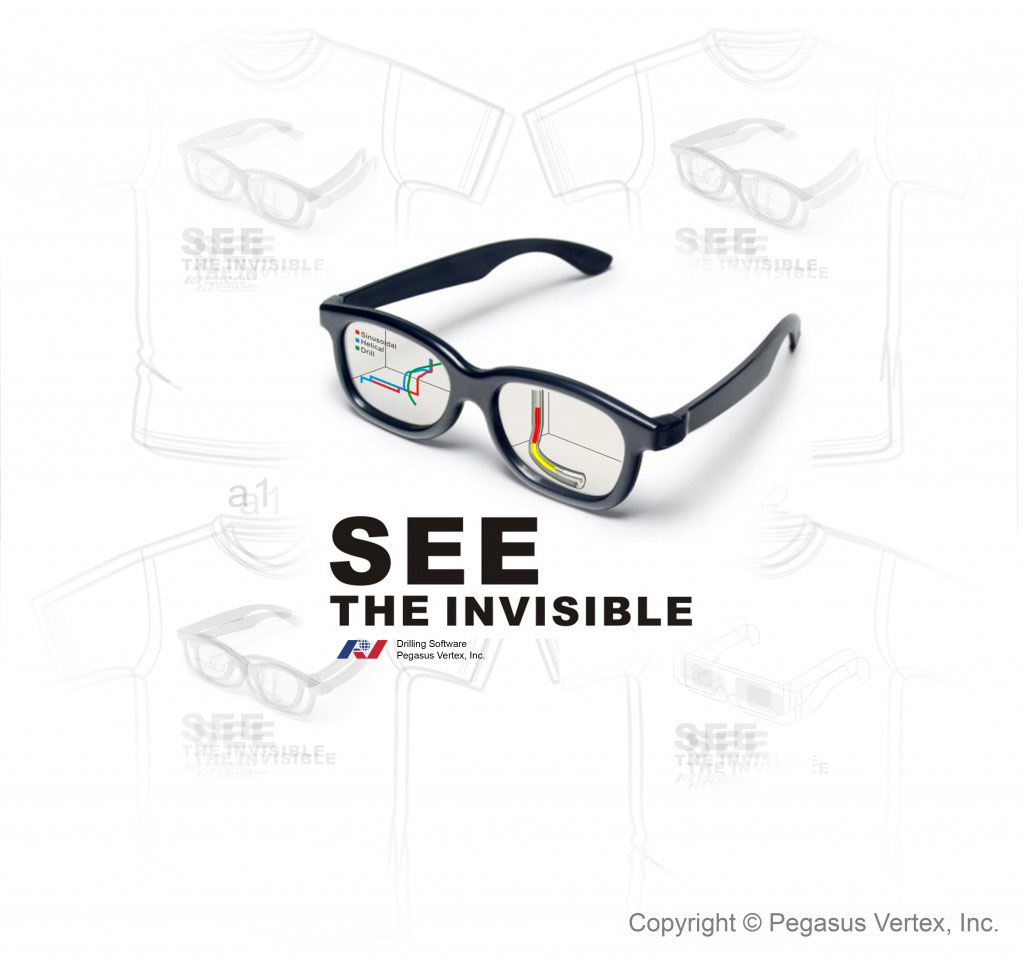
One of the submissions is a pair of glasses as shown below.

See the Invisible | Pegasus Vertex, Inc. - Drilling Software

As soon as we saw it, we liked it. It has a subtle message: our drilling software allows engineers to see the downhole condition, which is invisible to normal eyes.

Oil and gas well is created by drilling a hole of 5 to 50 inches in diameter into the earth with a drilling rig that rotates a drill string with a bit attached. During drilling process, engineers and drillers heavily rely on the limited information on the rig floor to determine the downhole condition, because they cannot see the subsurface.

Typically, only one tenth of iceberg is above water. Majority of iceberg is below water, making it difficult to determine its shape and size. Similar situation exists on the rig floor. Drilling engineers only have handful observations such as hookload, surface torque, pump pressure, ROP, RPM, etc. They can neither see what happens to drill string or formation nor accurately measure the buckling of the pipe. It is like a situation that we walk cross a muddy river: we cannot see the river bed, but our feet do their best sensing the water, mud and rock and send a message to our brains. Drilling operation is a dialog between drillers and formation in the dark. Drilling software turns on light to let engineers see the invisible.

Connecting Dots with Lines Using Drilling Software

Dots are isolated incidents, individual cases, snap shots, discrete numbers, etc. Looking at dots, we obtain limited information, but more often, we miss the big picture if our vision is restricted to the dots only.

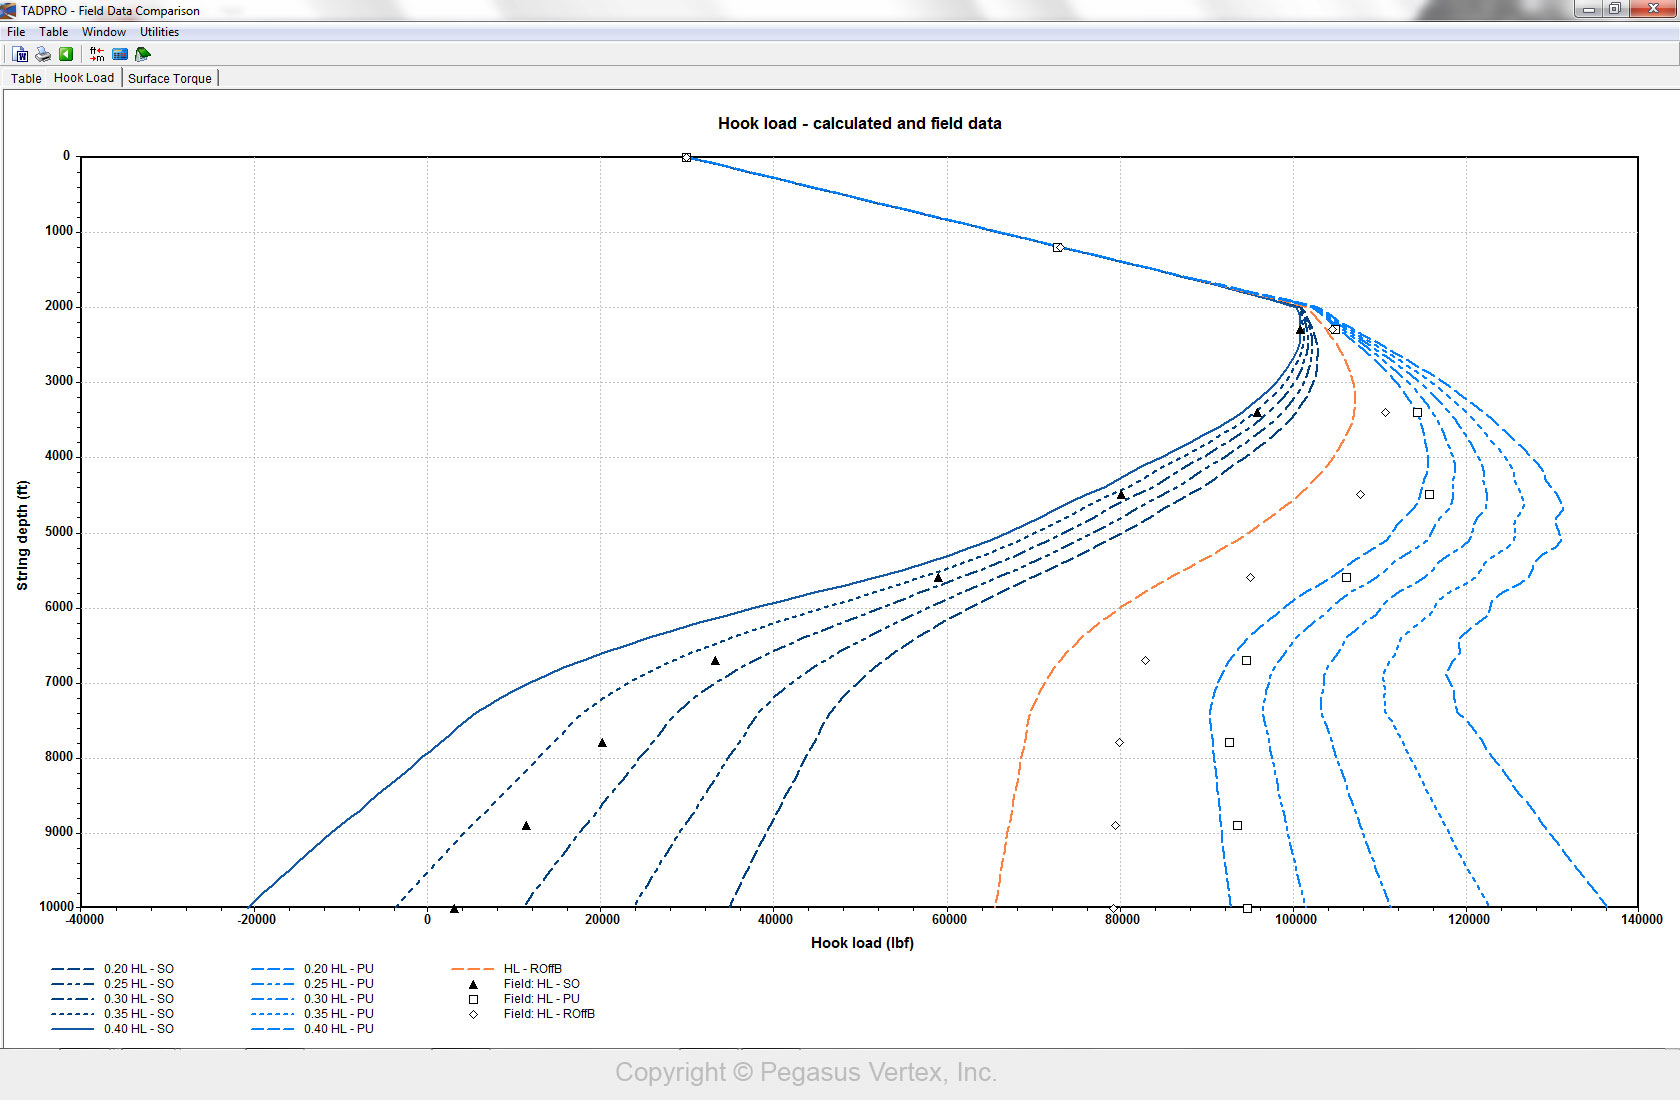
One of the uncertainties in torque and drag analysis for drilling is the friction factor, because it is dependent on many things such as mud type (oil-based or water-based), pipe moving in casing (steel) or in open hole (rock), cutting concentration, etc. If we can observe hookloads or surface torque for certain operation at various depths, we can calibrate friction factor (back calculation). The following picture is a screen from TADPRO (torque and drag model). You can see from the dots (field measurements) and the lines (model prediction) that the friction factor of 0.32 is a good estimation for slack off operation.

Dots and Lines in TADPRO Screenshot Pegasus Vertex

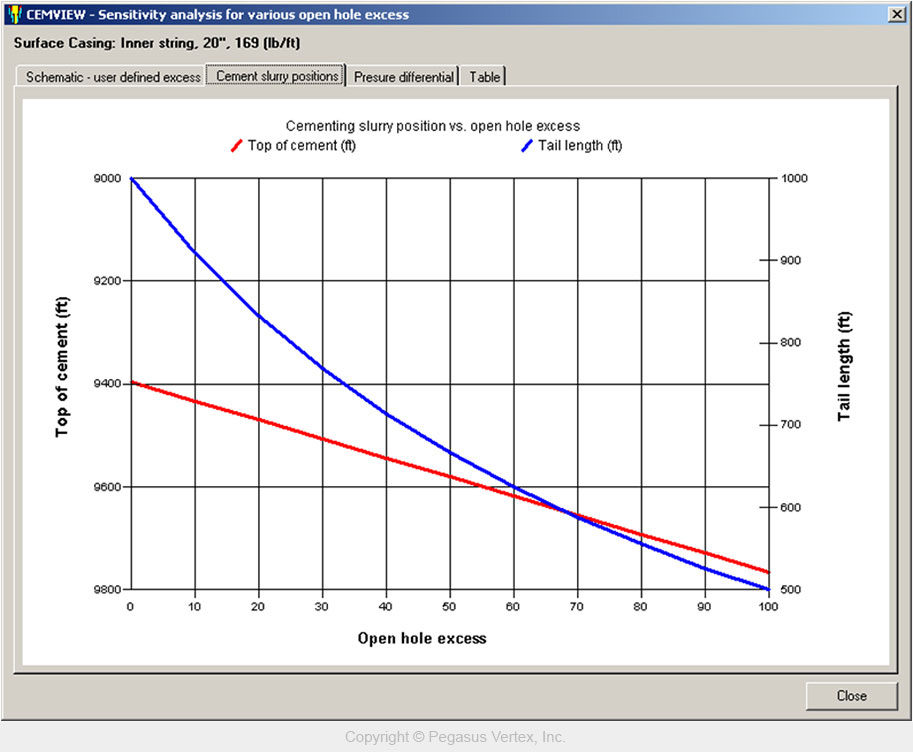
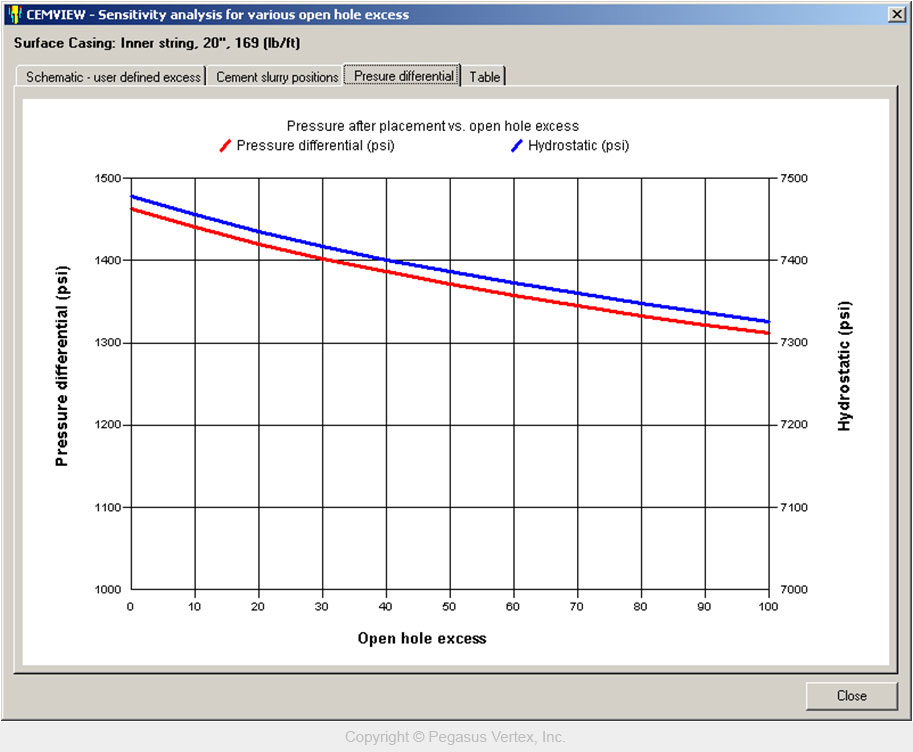
Individual case study with one set of input data only tells one story. If we can compile the output from multiple runs of computer model, we can see the trend. This process is automated in many of our drilling software models. The following pictures show the impacts of open hole excess on top of cement (TOC) and hydrostatic pressure difference.

Impacts of open hole excess on TOC - Pegasus Vertex

Impacts of open hole excess on hydrostatic pressure - Pegasus Vertex

We call this powerful feature of automatic run on multiple cases “Sensitivity Study”.

Steve Jobs once said this in his famous commencement address to Stanford University: “You can’t connect the dots looking forward; you can only connect them looking backwards. So you have to trust that the dots will somehow connect in your future.”

Connecting dots in our lives gives us confidence to follow our hearts even when it leads us off the well worn path.  Connecting dots in drilling engineering reveals the trends of operation date and window of safety to operate.

Let our drilling software assist you connect more dots.

Connecting dots with lines Pegasus Vertex