Dots are isolated incidents, individual cases, snap shots, discrete numbers, etc. Looking at dots, we obtain limited information, but more often, we miss the big picture if our vision is restricted to the dots only.
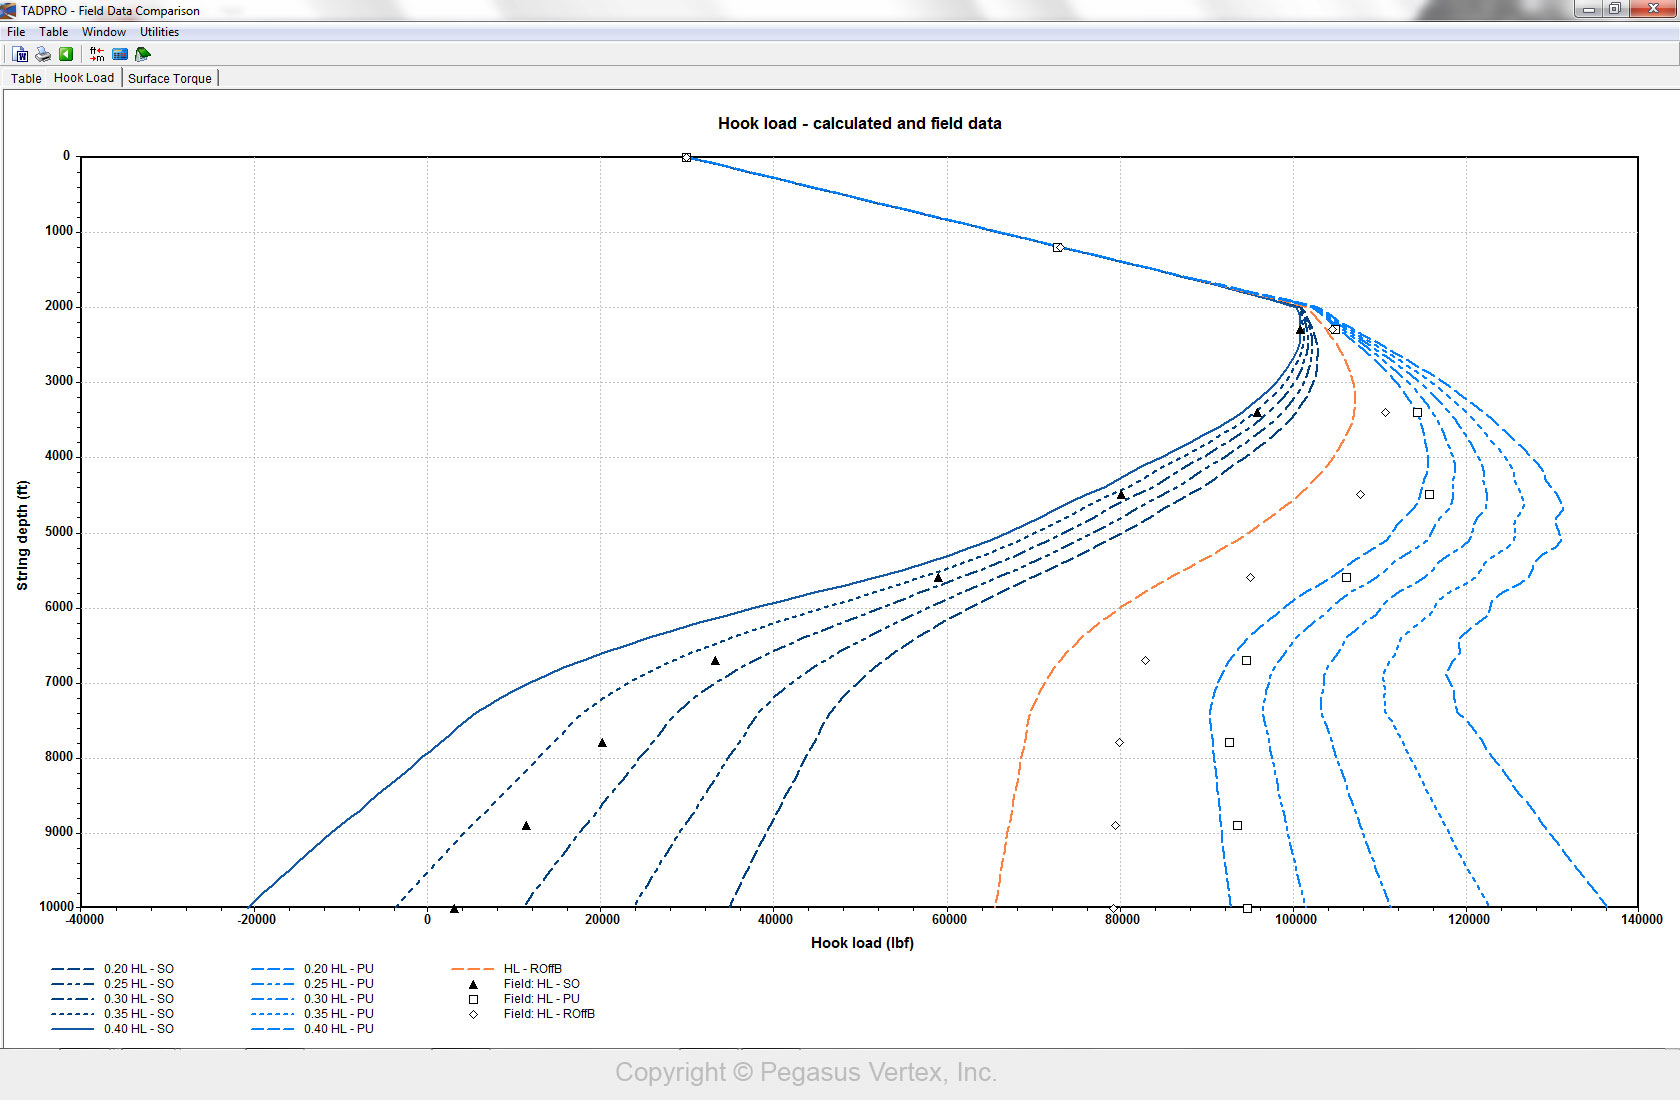
One of the uncertainties in torque and drag analysis for drilling is the friction factor, because it is dependent on many things such as mud type (oil-based or water-based), pipe moving in casing (steel) or in open hole (rock), cutting concentration, etc. If we can observe hookloads or surface torque for certain operation at various depths, we can calibrate friction factor (back calculation). The following picture is a screen from TADPRO (torque and drag model). You can see from the dots (field measurements) and the lines (model prediction) that the friction factor of 0.32 is a good estimation for slack off operation.
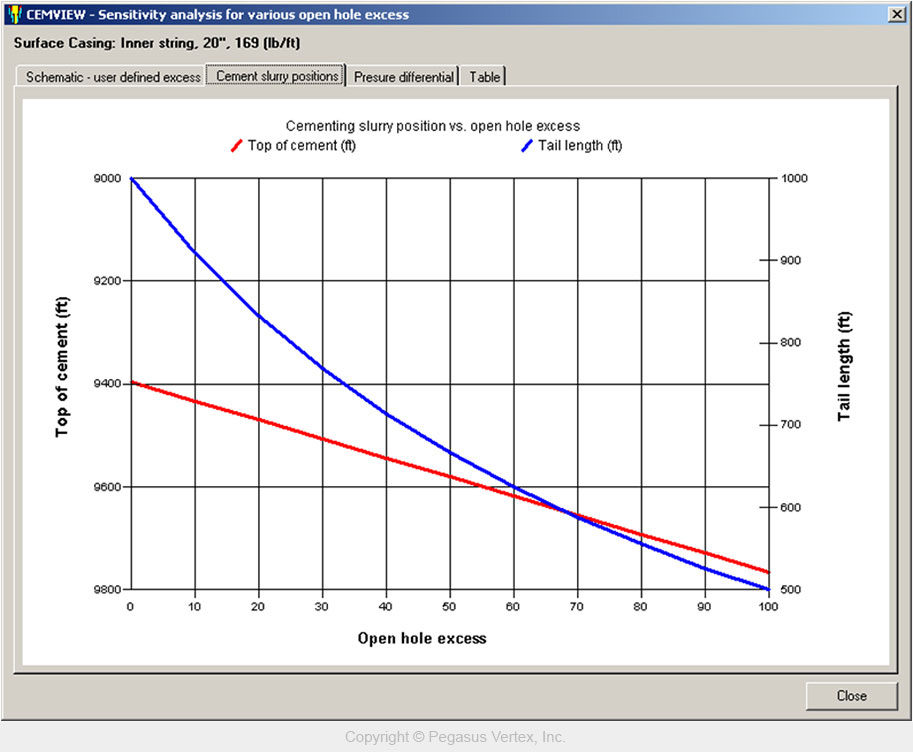
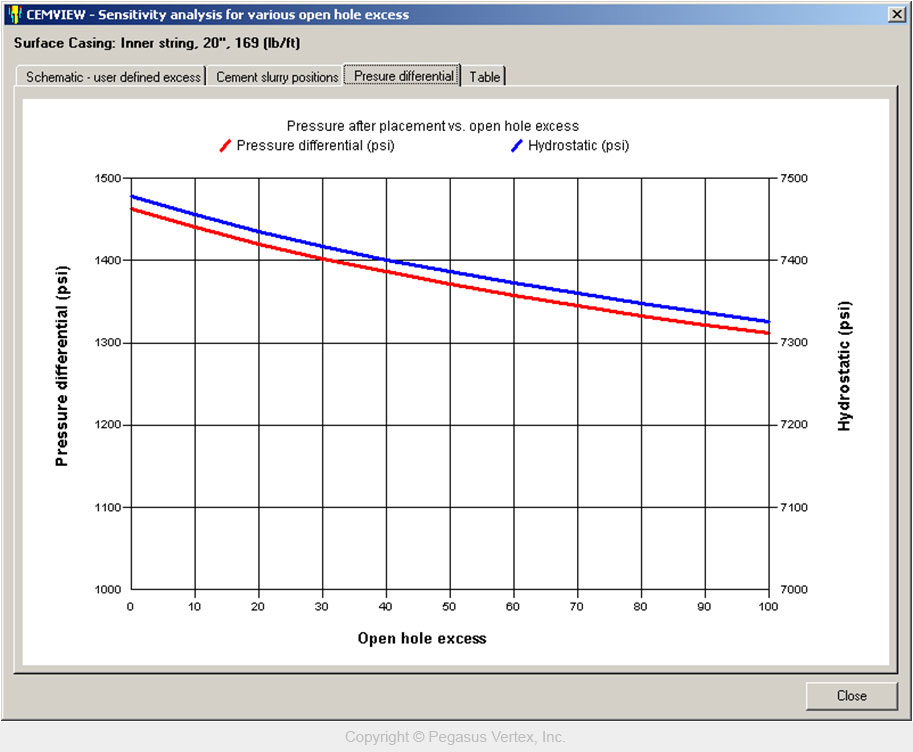
Individual case study with one set of input data only tells one story. If we can compile the output from multiple runs of computer model, we can see the trend. This process is automated in many of our drilling software models. The following pictures show the impacts of open hole excess on top of cement (TOC) and hydrostatic pressure difference.
We call this powerful feature of automatic run on multiple cases “Sensitivity Study”.
Steve Jobs once said this in his famous commencement address to Stanford University: “You can’t connect the dots looking forward; you can only connect them looking backwards. So you have to trust that the dots will somehow connect in your future.”
Connecting dots in our lives gives us confidence to follow our hearts even when it leads us off the well worn path. Connecting dots in drilling engineering reveals the trends of operation date and window of safety to operate.
Let our drilling software assist you connect more dots.


