Casing Wear Series – 3: Prevention

Computer casing wear modeling reduces risks and can identify potential problems prior to its occurring. Necessary modifications on casing designs and drilling parameters could be made before the pumping starts once we can predict the location and magnitude of wear.

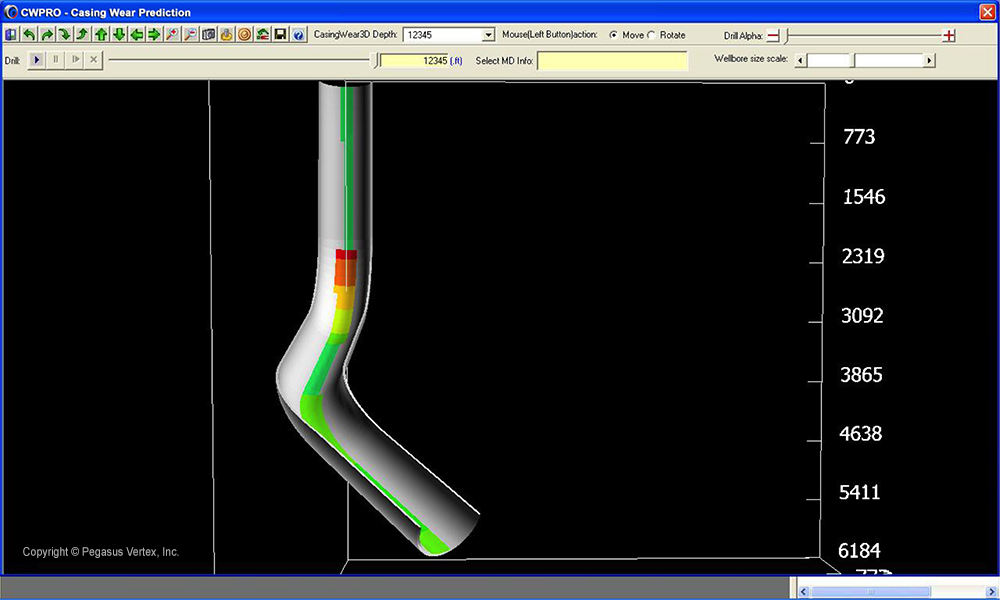
Figure 1 shows the 3D visualization of magnitude and location of wear in a previously set casing.

Figure 1. 3D Visualization of Casing Wear

The knowledge we have acquired through decades of studies, lab testing, post-job analyses and computer modeling provides a good foundation for the following casing wear preventive measures:

  • Minimize dogleg severity and expect real dogleg at least 1.5 times higher than the planned value.
  • Use casing friendly tool joint materials.
  • Reduce rotor speed and use downhole motor.
  • Increase ROP.
  • Select proper mud type and add lubricants to reduce wear and friction.
  • Use drill pipe protectors.
  • Use thick wall casing in the anticipated wear section area.
  • Use software to reduce risks.

Please go to www.pvisoftware.com/white-paper/Casing-Wear-Causes-Prediction-and-Prevention.pdf to download the complete Casing Wear white paper.

Casing Wear Series – 1: Causes

During the drilling phase, the most costly component is the casing. On top of the expensive casing materials and the costs likely to be encountered in cutting, pulling and replacing a worn or damaged string, casing wear creates more serious problems for operators due to its potential catastrophic incidents such as oil spills, blow outs or loss of the well.

To analyze the forces behind casing wear, we need to study the torque and drag (T&D) of the drill pipe during drilling operations. The basic mathematical and physical model of T&D has not changed significantly since Johancsik et al. published their paper on T&D prediction. Pipe movements such as drilling ahead or tripping create drag, while rotation produces torque. The magnitude of T&D is determined by the combination of these two movements.

Since the so-called vertical well virtually does not exist (the whirring action of the bit always creates a micro-helical shape of the well path), the contact of the drill pipe and its tool joint with the casing ID is unavoidable. The gravitational force acting on the drill pipe is always trying to pull the pipe to the lower side of the wellbore, while the axial tension on the drill pipe (in a build-up section) tends to push the pipe to the upper side of the wellbore. Depending on the pipe weight, dogleg severity, and axial force along the pipe, the drill pipe either touches the upper or lower side of the wellbore.

Typical T&D analysis starts by dividing the pipe into small elements. Calculation begins from the bottom element of the pipe, where weight on bit (WOB) and torque on bit (TOB) are expected. For each element, force and torque are balanced and the T&D at the top of the element are calculated. From bottom to top, calculations are performed for each pipe element, until it reaches the rig floor. This step-by-step calculation also determines the direction and magnitude of the side force, which pushes the drill pipe against the wellbore as shown in Figure 1.
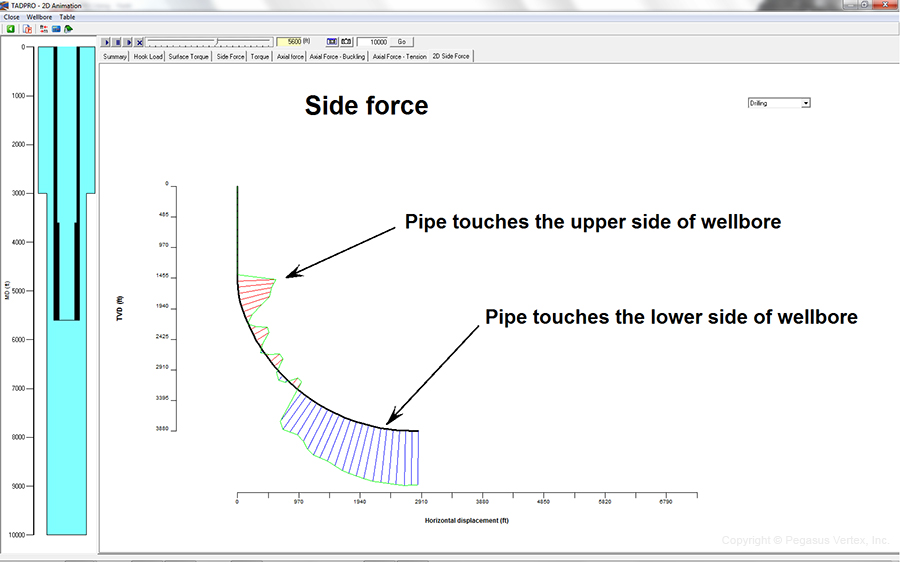
Figure 1. Snapshot of Side Force along a Drill Pipe

Figure 1. Snapshot of Side Force along a Drill Pipe

Under this side force, the rotating tool joint on the drill pipe against the casing inside, gradually removes steel from the casing wall and forms a crescent-shaped wear on the casing as shown in Figure 2.
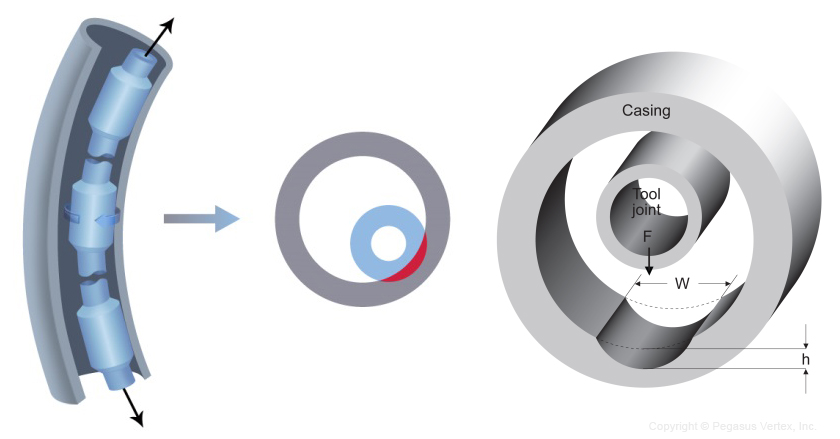
Figure 2. Rotating Tool Joint Wears Crescent Grooves in Casing

Figure 2. Rotating Tool Joint Wears Crescent Grooves in Casing

The seriousness of friction between two contacting surfaces is dependent on the nature of the rubbing surfaces and the mud.

The tool joint coating plays a bigger role here compared to the casing wall. The industry has seen tool joint coating evolve from “casing killer” (rough tungsten carbide) to “casing friendly” as shown by many high-tech hardbanding materials.

Tungsten carbide is applied on the tool joint. While it is a very good protector of the tool joints, it aggressively wears the casing so much that the mud type and its additive will not help much in reducing casing wear if rough tungsten carbide is present.

Once a casing friendly tool joint coating has been selected, the mud type and its additives play an intermediate role in casing wear. Water-based mud causes twice as much casing wear as the oil-based alternative. Lubricant reduces friction and severity of the wear.

Generally speaking, high dogleg will create a high side force and severe casing wear. The wear profile resembles the shape of dogleg severity. Higher RPM and lower ROP make more rotation time between the tool joint and casing and will cause aggressive wear.

The following conditions contribute to casing wear:

  • Well path and dogleg
  • Drill pipe weight
  • Tool joint coating
  • Mud and additives
  • RPM and ROP

One Hundred Percent

"I'll take fifty percent efficiency to get one hundred percent loyalty."
- Samuel Goldwyn (American Producer)

It’s well known that time and cost overruns are very common in the oil and gas industry. As a matter of fact, most projects deal with one or both problems, yet there is an alternative: the industry could reduce costs and accelerate projects by implementing advanced models that bring good benefits and are very efficient.

Being efficient means achieving maximum productivity with minimum wasted efforts and/or expenses.

For a company to have an effective way in its productivity there has to be a change that influences its efficiency; a change that identifies the difference between doing the right thing and doing things right.

In the beginning process of developing a software here at PVI, we put into consideration what is effective for our clients but more so, what is efficient. We think of what can be done to make our clients' workload lighter yet progressive. With our software, casing wear can be predicted, centralizer placement can be optimized, torque and drag can be calculated, mud reporting can be simpler, and many other things can be performed. One of our priorities is to produce a software that gives our clients their desired or intended result.

A software that’s efficient is a software capable of doing processes that save time, money and efforts. That's a good characteristic to have in a software, because it helps the companies that use it to be effective at getting results.

Efficient | Drilling Software - PegasusVertex, Inc.

Instead of just striving to design an effective software, we strive to design a software that is efficient at being effective. Similar to what Samuel Goldwyn stated, instead of taking 50% of efficiency, we intend to take 100% efficiency to get 100% of loyalty from our satisfied customers.

I Never Felt So Good When Taking Off My Shoes

During Thanksgiving weekend, our company staff and families went to Lake Tahoe to have a retreat. Skiing was one of the activities. Quite a few of us were first time skiers. Here are some of our children expressing their experience on wearing the ski boots.

Rachel: "I felt short when taking off the shoes."

Nathan: "I never felt so good when taking off my shoes."

Nowadays, almost all our activities are enriched with high-tech equipment. Skiing is no exception. A pair of ski boots can easily weight a few pounds. Walking with them is no fun. But once the shoes are attached to ski and ski is on the slope of snow, they make us run faster on snow than on road. Technology makes wonders. Besides specific skills and physical training, more sportsmen rely heavily on gears to enhance their performance. To swimmers, it is swimming suit; to tennis players, it is racket and strings and also as the running shoes to runners. The pairs can go on.

These enabling technologies also play big role in our drilling industry, making drilling operations more cost effective and safe. Among them is drilling engineering software. Even though the drilling software does not weight as much as ski boots, it carries the significant results of research and engineering in the areas of pipe mechanics, hydraulics, casing wear, etc.

One might think the drilling software as one more package to install in computer, one more burden to carry. However, the benefits of running drilling software far out weight the cost or trouble of using it.

Download and installation of our MUDPRO (mud reporting software) may take 15 minutes. Once mud engineers start to use MUDPRO, they could easily save hours of work every day, not to mention the much better quality of report and end-of-well recap.

Sometimes, a little bit trouble, such as wearing heavy ski boots, brings tremendous convenience; sometimes, a little bit spending is rewarded with big saving.

Just as Nathan described his feeling on ski boots, our MUDPRO user might say: "I never felt so relieved when making daily mud report."

Casing Wear Series - 11: A Little More About Rubber Pipe Protectors

If rubber pipe protectors can be used, they will greatly reduce wear in intermediate casing. However, if they are to be used, it is recommended that they not be run during the first bit run out of casing. Running rubber protectors in newly installed casing, they will encounter high frictional resistance to rotation. This is caused by the layer of mill scale and rust on the surface of the new casing. Until this layer is removed, the coefficient of friction will be very high, and, in some cases, Hade made it impossible to rotate the drill string.

This behavior is pictured in Figure 1.

Drill Pipe Protector Friction VS Time

Figure 1: Drill Pipe Protector Friction VS Time

If analysis of the directional survey and drilling program indicates that casing wear will be a problem, it is recommended that 2 protectors be used on each drill pipe: one on one end of the pipe, and the other at the middle of the pipe.

CWPRO was developed to conduct this analysis. The results of a CWPRO analysis will indicate exactly where and how severely casing wear can be expected.

A typical rubber pipe protector is shown in Figure 2. Since these rubber protectors will tend to restrict mud flow up the hole, some manufacturers have cut `flow channels’ in their protectors to reduce their flow resistance. Figure 3 shows two configurations of a `fluted’ protector. The one on the left, with the `straighter’ flutes will offer slightly less flow resistance to the drilling fluid, but will be a source of drillstring vibrations. Therefore, the `spiral fluted’ protector on the right is preferable.

Still better, both from the standpoints of flow resistance and vibration, is the configuration shown in Figure 4. We used to refer to this configuration as our `tractor tire’.

All these drill pipe protectors are clamped to the drill pipe, and rotate with it. Another option is a system where the body of the protector is stationary with respect to the casing. The body of the protector rotates in two end bearings, which are clamped to the drill pipe. This avoids the uncertain friction generated by rotation of the body of the protector with respect to the casing.

Slick Protector

Figure 2: Slick Protector

Fluted Protector

Figure 3: Fluted Protector

Hydril Diamond Type Protector

Figure 4: Hydril Diamond Type Protector

Western Well Tool Non Rotating Pipe Protector

Figure 5: Western Well Tool Non Rotating Pipe Protector

Western Well Tool developed such a `non rotating’ pipe protector which was quite successful. This unit, shown in Figure 5, consists of three pieces: Two end pieces which are clamped to the drill pipe, and a rubber center section which rotates between these end pieces. The end pieces provide low friction bearings upon which the center body rotates. These three pieces are shown in Figure 6.


Elements of Non Rotating Protector

Figure 6: Elements of Non Rotating Protector


Western Well Tool non rotating protectors have been used in several wells (that I know of) to remedy the excessive torque required to rotate the drill string.

Casing Wear Series - 10: Zero Casing Wear?

Although some of the proprietary hardbanding alloys can significantly reduce casing wear, there is only one material which we know of will spectacularly reduce the wear groove depth limit. What is this marvelous material?

Rubber!

Rubber? Yes, rubber. 70 durometer rubber.

This was discovered as a result of a casing wear test using a specially built pipe protector as a tool joint.

What we discovered was that the `wear groove’ was a `mirror finish’ strip where the wear groove should have been. This results from the fact that the rubber `tool joint’ polishes the inner wall of the casing instead of grinding it. The polishing mechanism is pictured in Figure 1.

The Mechanism of Polishing

Figure 1 - The Mechanism of Polishing

This is the same mechanism that has been used for centuries to polish optical elements.

The difference between grinding and polishing is that the abrasive particles imbed themselves into the pliable surface of the rubber (or pitch, beeswax, wood, paper, or felt) protector, and `shave’ very small elements of the casing surface. The pliable surface of the rubber tends to orient the abrasive particles rather than to give them an unyielding background against which to push into the casing surface, exceeding its yield, and fracturing the casing surface.

The extremely low casing wear using a rubber `tool joint’ is shown in Figure 2. This figure shows a plot of the casing wear data from an 8-hour test in which the steel tool joint is replaced with a rubber pipe protector. The casing wear groove rapidly reaches a depth limit of 0.005 inch, and produces a mirror finish on the 0.653 inch wide wear groove.

Wear Test of Rubber Pipe Protector

Figure 2 - Wear Test of Rubber Pipe Protector

To put this into perspective, Figure 3 shows the results of three casing wear tests. These are all with N – 80 casing in a water-based mud containing 7 volume % Clemtex #5 sand. The upper plot of the figure is data using a steel tool joint. The second plot is data using a tool joint hardbanded with BOLTALLOY, and the bottom trace is data from the test using a rubber protector as a tool joint.

Steel Boltolloy and Rubber Tooljoint

Figure 3 - Steel, BOLTALLOY, and Rubber tool Joints

So why aren’t rubber pipe protectors routinely used to protect intermediate casing strings? They have a couple of limitations: (1) thermal and (2) chemical.

In Casing Wear Series - 11, we will talk about a few of the properties of rubber pipe protectors.

Casing Wear Series - 9: Contact Pressure Threshold (Part 2)

Contact pressure threshold can be demonstrated using a plot of casing wear test data such as that shown in the upper curve in Figure 1. First, the plot of wear groove depth vs. elapsed test time is transformed to a function of wear groove volume vs. work function, as is shown in Figure 1.

Figure 1: Wear Groove Volume vs. Work Function

Figure 1: Wear Groove Volume vs. Work Function

From the relation of wear groove volume vs. work function, the differential wear factor ( the slope of the curve shown in Figure 1) as a function of contact pressure, and shown in Figure 2, can be determined.

Figure 2: Differential Wear Factor vs. contact pressure.

Figure 2: Differential Wear Factor vs. contact pressure.

Figure 2 clearly shows that the differential wear factor, which is the rate of casing wear, intersects the horizontal axis at 70.8 psi., and is equal to zero for contact pressures less than this value. The value (70.8, 0) is the end of the curve, and not just its intersection with the horizontal axis.

The contact pressure threshold of any casing wear system can be determined from the casing wear test data and used to establish the wear groove depth limit for this same system where the geometry differs from that used in the casing wear test. Thus, wear groove depth limits can be estimated for field operations.

If the contact pressure threshold is less than 80 psi, the wear groove depth limit will probably be greater than the thickness of the casing wall. This is the case for most tool joint/casing/drilling fluid combinations.

Some of the proprietary hardbanding samples that have been tested against N –80 casing running in water based mud have exhibited contact pressure thresholds of as much as 200 psi. and wear groove depth limits, under test conditions, of 0.02 inches.

I have not seen quantitative field data confirming the results obtainable using proprietary hardbanding materials , but the continued sales of these products is an indication that the operators are convinced that they do significantly reduce casing wear.

Casing Wear Series - 8: Contact Pressure Threshold (Part 1)

If the casing wear groove depth limit is to be regarded as a `real world’ quantity, and not just a`mathematical peculiarity’, two things are required.

1. Experimental verification of the wear groove limit, and

2. A reasonable explanation for the existence of this casing wear groove depth limit.

An example showing (1) the existence of the casing wear groove depth limit and (2) the effect of tool joint hardbanding (Boltalloy) on casing wear depth is presented in Figure 1.

The upper curve represents the casing wear test data from Test # C – 3. In this test, the casing was 9 5/8 inch, 47 ppf N – 80: The tool joint was fabricated from AISI 4145 steel: and the drilling fluid was a 10 ppg. Water based mud containing 7 volume % Clemtex # 5 sand. The casing wear groove depth at the end of this 8 hour test was 0.081 inches.

The lower plot, labeled `BOLTALLOY’ , represents test data from a system which differs from that of the C – 3 test only in the metallurgy of the tool joint. The tool joint was hardbanded with a proprietary alloy. The depth of the casing wear groove was 0.02 inches at the end of this 8 hour casing wear test.

Use of the proprietary hardbanding reduced the casing wear groove depth in the N – 80 casing to a maximum depth limit of 0.02 inch. This is in contrast to the 0.1739 depth limit predicted for the N – 80 casing in the presence of the unhardbanded AISI 4145 steel tool joint.

The time required to reach 90 % of the wear groove depth limit for the BOLTALLOY test was 1.56 hours.

These results are similar to many other results that have been obtained during the DEA 42 Casing Wear Program, and they confirm the existence of the casing wear groove limit. It is a physical reality.

Casing Wear Depth Limit

Figure 1: Casing Wear Depth Limit

NOTE: Observations and conclusions regarding the performance of casing wear systems (which consist of (1) casing, (2) tool joint, (3) drilling fluid, and (4) operating conditions) are based on mathematical analyses of the statistical curve fit to the casing wear test data.

Casing Wear Series - 6: Some Pictures

Not many examples of casing wear are retrieved from field operations. Pulling casing is expensive, and if the damage can be nullified by running and cementing an intermediate casing liner, rather than pulling the damaged string, that will probably be done. As ever, if there are two possible solutions to a field operational problem, the least expensive one will be implemented.

Figure 1: Burst Liner

Figure 1: Burst Liner

Figure 1 shows a typical liner failure. Wear is greatest at the top of the liner, and decreases as you progress downward. If wear continues long enough, the liner wall thickness is reduced to the point where the burst strength of the thinned wall is less than the internal pressure. The resulting burst is a tapered opening, largest at the top of the liner, tapering downward.

Figure 2 shows two wear grooves in a liner hanger wear bushing. After inspection revealed the first wear groove, the bushing was rotated 180 degrees before being reinstalled, thus resulting in the formation of the second wear groove.

Casing or riser wear occurs where the borehole either changes direction (dogleg or a flex joint) or diameter (top of a liner).

Dogleg severity can be determined from a directional survey of the well. With dogleg severity and drillstring tension, the lateral load on the casing can be calculated. This allows casing wear as a function of well depth to be calculated.

Where we deal with a change of well diameter - such as at the top of a liner - we have no reliable way to calculate lateral load. Therefore, we assume the worst and install wear bushings at the top of liners.

Figure 2 demonstrates the value of a wear bushing. Better the bushing should wear, rather than the top of the liner hanger.

Figure 2: Wear Groove in Liner Hanger

Figure 2: Wear Groove in Liner Hanger


Figure 3 shows the split resulting from burst failure at the top of a flex joint. This failure occurred in a section weakened by internal wear. Internal view of this split is shown in Figure 4.

Figure 3: Split at the top of Flex Joint

Figure 3: Split at the top of Flex Joint

Figure 4 is a view of the split shown in Figure 3, looking from the inside out.

Figure 4: Another View of the Failed Flex Joint

Figure 4: Another View of the Failed Flex Joint

Figure 5: Wear Groove in Upper Element of Flex Joint

Figure 5: Wear Groove in Upper Element of Flex Joint

Casing Wear Series - 5: What Have We Learned?

First of all, we realized that the data obtained from a casing wear test did not represent a single property of any one of the three elements (casing, tool joint, drilling fluid) of the casing wear system being tested.

The curve of ‘wear groove depth’ vs. ‘test time’, such as that shown in Figure 1, shows the performance of the entire casing wear system under the operating conditions of the test.

Wear Groove Depth VS Elapsed Test Time

Figure 1: Wear Groove Depth VS Elapsed Test Time

Next, we learned that casing grade, such as K-55, N-80, C-95, was not a good indicator of wear properties. Wear factors for various samples of N-80 casing were uncertain to ± 50%. Often there would be a significant difference in the wear factors obtained from casing samples cut from opposite ends of a 40 foot casing joint. Later tests showed a remarkable lack of correlation between wear factor and just about everything else associated with the composition of the casing alloy.

Every casing wear system should be regarded as unique and individual, and probably not related to any other casing wear system.

The Maurer ‘Wear Factor’, shown in Figure 2, has been shown to predict the performance of casing wear systems encountered in drilling operations with an uncertainty that is consistent with the uncertainty of the field measurements.

What is important in estimating casing wear to be expected during drilling operations is whether the casing wear factor will be 0.2 (oil based mud), 1.0 (some of the new hardbanding alloys), 5 to 8 (unprotected tool joints), or as high as 50 or 70 (X-80 as used in riser pipes).

Remember that we said that casing grade was no indicator of casing wear rate? I make an exception for X-80, a line pipe, often used as the basis for 21 inch riser pipes. At first, we didn’t believe our own results, but, yes, it was true. This explains the severity of riser wear adjacent to the flex joint at the wellhead.

Casing Wear Groove Volume VS Work Done by Tool Joint

Figure 2: Casing Wear Groove Volume VS Work Done by Tool Joint

The result of extremely high casing wear rate is shown in Figure 3. The tool joint was hardbanded with rough tungsten carbide, as shown in Figure 1 of Casing Wear Series – 1: How we got here?.

Extremely High Casing Wear Rate

Figure 3: Extremely High Casing Wear Rate

This is why rough, field applied Tungsten Carbide has largely been abandoned as a means to protect tool joints during drilling operations. It does protect the tool joints, but is a bit hard on the casing.