How to Optimize Bridging Blend to Seal the Formation Surface (Part III)

The best way to optimize parameters is to use software like PVI’s BridgePRO, the bridging agent size selection software, to formulate the PSD to most effectively seal the reservoir formation. The software optimization simulation iterates up to 4,600,000 calculations to find the best possible solution according to the target line position, blend volume % of each product, coefficient of determination and the deviation results. The two optimization parameters to determine the best blend formulation are coefficient of determination and deviations.

  1. Coefficient of Determination, R2
    Coefficient of determination [1] is a measure used in statistical model analysis to assess how well a model explains and predicts future outcomes. It is indicative of the level of explained variability in the model. The coefficient, also commonly known as R-square, is used as a guideline to measure the accuracy of the model.
    BridgePRO uses the coefficient of determination to test the goodness of fit of the blend line to the target line. It is expressed as a value between zero and one. A value of one indicates a perfect fit. A value of zero, on the other hand, would indicate that the blend line fails to accurately model the target line.
  2. Deviations
    BridgePRO optimization simulation takes into account the deviation of five points on the formation characteristics target line with the corresponding points on the blend formulation line. The points considered on the cumulative volume % vs. diameter target and blend lines are D10, D25, D50, D75 and D90. Ideally, the best blend line should have the smallest and positive deviations. BridgePRO takes into account both coefficient of determination and the deviations to determine the best blend line slightly on the right side of the target line.

In conclusions, non-damaging RDF design starts with selecting bridging agents with an ideal size distribution to effectively seal the formation surface.

Abrams’ 1/3 rule defines the effectiveness of a bridging material to initial mud solids invasion. However, it does not give optimum size or address the best packing sequence of particle size for minimizing fluid invasion and optimizing sealing.

The ideal packing theory defines the full particle range required to seal all pores, even those created by the bridging agents.

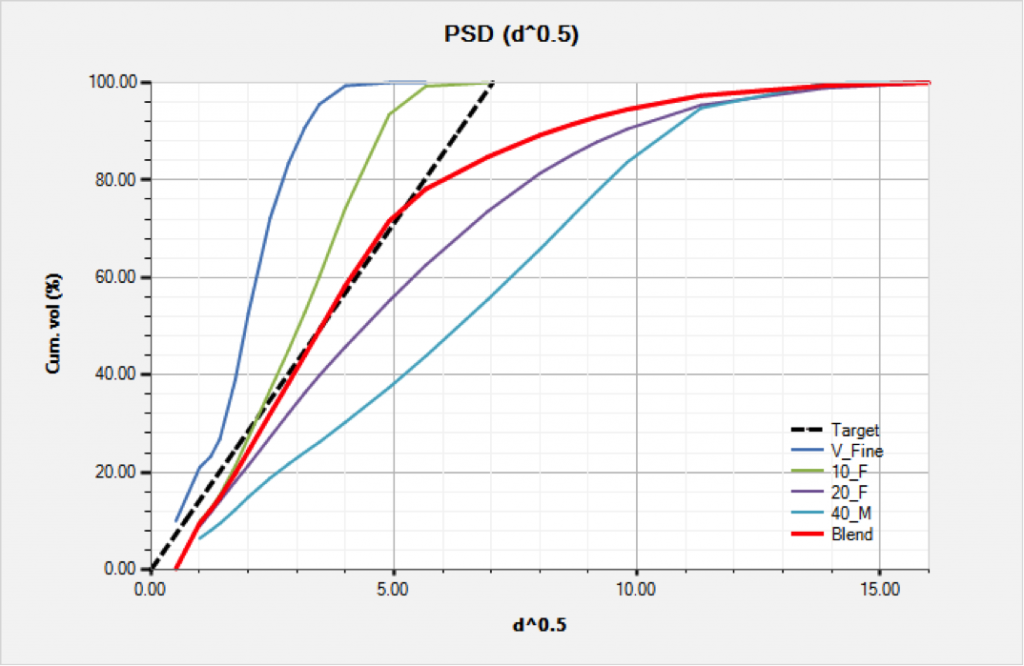
BridgePRO simulation finds the best possible blend formulation according to the target line position, blend volume % of each product, coefficient of determination and the deviation results.

References

  1. Pavel E. Guarisma, Least squares regression, North Carolina State University, http://herkimershideaway.org/apstatistics/ymmsum99/ymm333.htm

How to Optimize Bridging Blend to Seal the Formation Surface (Part II)

There are following methods to optimize blending formulation.

  1. Graphical Approach of IPT
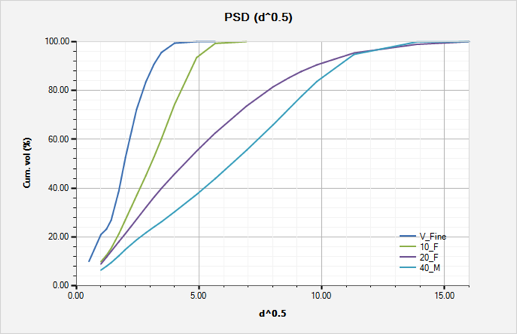
    Dick [1] took a graphical approach to determine the optimum particle-size distribution of bridging material for the given formation characteristics. A wide range of commercially available bridging agents is plotted on the same graph utilizing the D1/2 rule as shown in Fig. 3. Although there is no single bridging agent that exactly matches the optimum target line, a more ideal formulation can be achieved by blending various sized-bridging agents to seal the targeted formation as shown in Fig. 4.

    Fig 3. Commercially available products for bridging permeable formations

    Fig 3. Commercially available products for bridging permeable formations

    Fig 4. The blend PSD line and the target line

    Fig 4. The blend PSD line and the target line

  2. Optimum Target Line
    An optimum target line based on formation information must be plotted before the optimum bridging agent blend can be determined. The design process normally starts with the “worst-case” possibility based on the largest dominant pore size or fracture width. The preferred method is to use pore sizing data from thin section analyses. However, if pore sizing data is not available then the formation permeability information can be used to determine the optimum target line.
    Zhang [2] proposed methods for determining the optimum target line. His rule is:

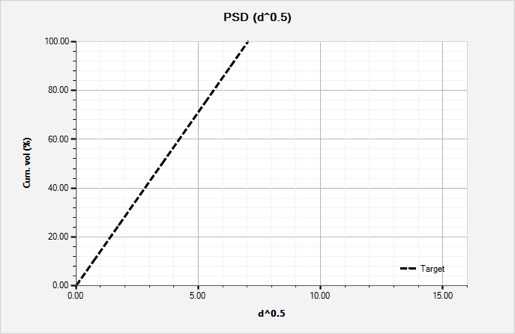
    1. Select the largest represented pore size from thin section analyses. This is the D90 point on the target line or 90% of cumulative volume shown in Fig. 2.  D90 means 90% of the particles are smaller than size X.  A straight line is then plotted by connecting the origin of Cartesian coordinate to the D90 point.
    2. If the pore size data is not available then the known permeability of the formation can also be used.
      1. If the maximum permeability is available then the maximum pore size D90 point can be estimated by taking the square root of the maximum permeability (in mDarcy).
      2. If the average permeability is known then the medium pore size D50 can be estimated by taking the square root of the average permeability (in mDarcy). The target line and the largest pore size D90 can be extrapolated by connecting the origin of Cartesian coordinate to the D50 point.
  3. Blend Line
    Blending the proper ratio of bridging materials can help to obtain a more ideal formulation for sealing a given reservoir formation. The particle size distribution of the blend line should have a slope close to that of the optimum target line. The blend line is preferably slightly on the right side of the optimum target line. Experience [3] shows that this ideal formulation generally composed of three grades of bridging agents with different particle size as shown in Fig. 4. Calcium carbonate with a different particle size is commonly being used as bridging agents.
    It has been found that 2-3% by volume (20-30 lb/bbl or 60-90 kg/m3) of a proper blend of bridging agents can provide an optimum seal on the face of permeable zones in clean fluids. In heavier weighted fluids, such as those containing barite, guidelines are more flexible with emphasis on larger diameter particles, recommend 3-5% by volume of properly sized solids. Yan [5] recommended the size of the coarse particles should be 4-5 times larger than the very fine particles in order to achieve the highest packing efficiency.

References

  1. SPE 58793, Optimizing the Selection of Bridging Particles for Reservoir Drilling Fluids M.A. Dick, T.J. Heinz and C.F. Svoboda, M-I L.L.C., and M. Aston, BP Amoco
  2. ZHANG Jin-bo,YAN Jie-nian. New theory and method for optimizing the particle size distribution of bridging agents in drilling fluids[J]. Acta Petrolei Sinica, 2004, 25(6): 88-91,95.
  3. SPE 104131,  Design of Drill-in Fluids by Optimizing Selection of Bridging Particles, Yan Jienian, SPE, and Feng Wenqiang, China U. of Petroleum, Beijing

How to Optimize Bridging Blend to Seal the Formation Surface (Part I)

Protecting the pay zone from damage is critical to realize the full potential of any well. Reservoir drill-in fluids (RDF) are designed to prevent formation damage due to fluid invasion and solids plugging. A poorly designed RDF may react with the formation fluid creating blockage or restriction for the natural flow of the reservoir. A large range of undesired solid particles from drill solids, fluid chemicals and clay viscosifiers may end up plugging the reservoir pores. The technique for designing a non-damaging RDF is to start with selecting bridging agents with an ideal size distribution to effectively seal the formation surface.

We are going to list a couple of theories behind bridging agent size selection.

  1. Abrams’ rule
    Abrams [1] proposed a rule for formulating minimally invading, non-damaging drill-in fluids. This rule states that the mean particle size of the bridging agent should be equal to or slightly greater than 1/3 the medium pore size of the targeted formation. For example, the rule predicted that those 50μm bridging particles should be effective at sealing pores up to or around 150μm in diameter. Abrams also suggested that the concentration of the bridging solids used should be at least 5% by volume (50 lb/bbl or 150 kg/m3) of the solids in the fluid.
    However, Abrams only addresses the particle size that initiates a bridge. His rule does not give the optimum size or address the best packing sequence of a particle size for minimizing fluid invasion and optimizing sealing. The fluid design using these guidelines tends to use a wide range of particles in an attempt to provide a wide range of bridging capabilities.
  2. Ideal Packing Theory (IPT)
    Ideal Packing Theory can be defined as a full range of particle size distribution required to effectively seal all voids, including those created by bridging agents.
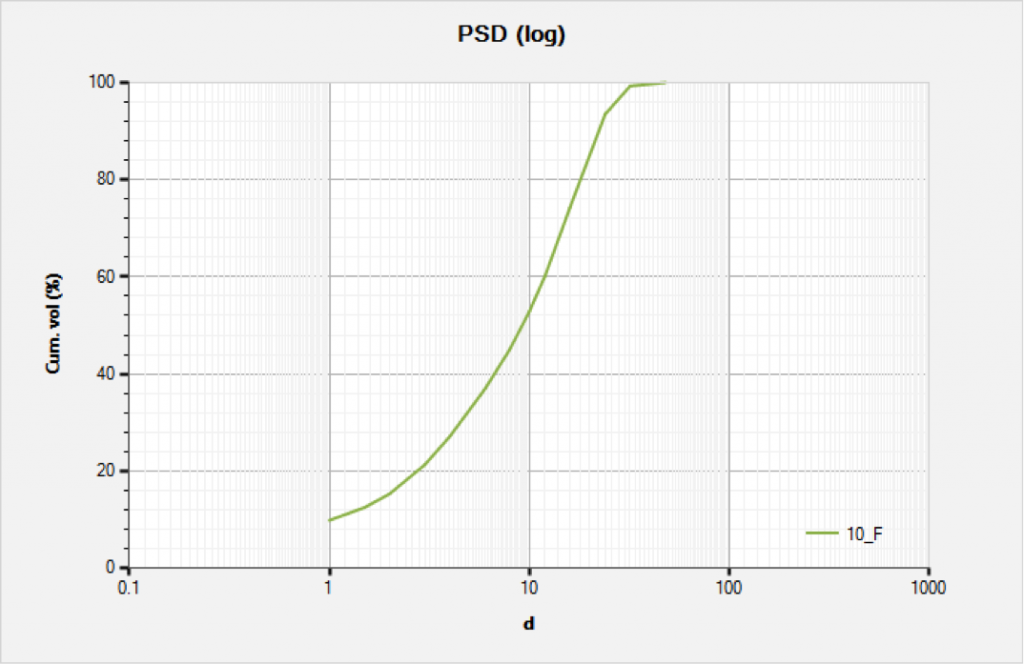
    Fig. 1 shows a typical particle-size distribution for a solid bridging material. Generally, the cumulative volume curve forms an S-shape when plotted on semi-log coordinates. Any commercially available particle-size analysis devices can generate these S-shape plots.

    Fig1. PSD of a Commercial Bridging Product

    Fig 1. PSD of a Commercial Bridging Product

    Kaeuffer [2] employed theories for particles by Furnas and Fuller-Bollomey to generate a simple Ideal Packing Theory also known as the D½ rule. This rule states that ideal packing occurs when the percent of cumulative volume vs. the D½ forms a straight-line relationship as shown in Fig. 2, where D½ is square root of the particle diameter. These subsequent layering of bridging agents results in a tighter and less invading filter cake.

    Fig 2. Ideal Packing

    Fig 2. Ideal Packing

References:

  1. Abrams, A.: “Mud Design to Minimize Rock Impairment Due to Particle Invasion,” JPT (May 1977) 586.
  2. Kaeuffer M.: Determination de L'Optimum deRemplissage Granulometrique et Quelques proprieties S’y Rattachant. Presented at Congres International de I’A.F.T.P.v., Rouen, Oct. 1973