Calculation and Prediction

The pulling and running of pipe causes pressure surges and the prediction of these is a matter of economic importance in wells where the pressure has to be maintained within narrow limits to prevent formation-fluid influx and lost circulation. When these types of situations occur, the drilling engineer needs the best possible method of calculating and predicting surge pressures to drill these wells with a minimum of risks.

Pressure surges have been known for a very long time to cause well-control problems. For instance in 1934, pressure surges were identified as a result from pipe swabbing the possible cause of fluid influx, and in worst cases, blowouts. Also In 1951, positive pressure surges were measured and linked to lost-circulation problems.

For most wells, the extent of the pressure surges is not critical when the proper casing design and mud programs leave large enough margins between fracture pressures and formation-fluid pressures. However, a certain fraction of wells cannot be designed with large surge-pressure margins and in this situation the pressure surges may still be a concern.

The need to predict pressure surges in critical wells is the reason PVI developed SurgeMOD.
SurgeMOD - Surge Pressure Prediction SoftwareWith this surge and swab pressure prediction model, the annular pressures are calculated to be consistent with frictional pressure drops caused by fluid motion; the drilling mud can be well displaced by the pipe motion. This model is sufficient for an effective use for both drilling and completion. It analyzes the complex downhole hydraulics when running the casing for various pipe conditions and circulation sub tools. SurgeMOD not only predicts the surge and swab pressures for a given running speed, but also calculates maximum running speeds at various depths. After the casing or liner is set, it will calculate the maximum acceptable circulation rate before fracturing the formation.

This surge and swab pressure model shows an excellent agreement with the measurements of surge and swab pressures collected during the field tests. It accurately predicts maximum surge and swab pressures as well as the variation of pressure with time at any position in the well bore. Predicting surge and swab pressures using SurgeMOD can minimize potential problems in a well bore and allow more efficient trip speeds for running or pulling pipe.

Casing Wear Series – 3: Prevention

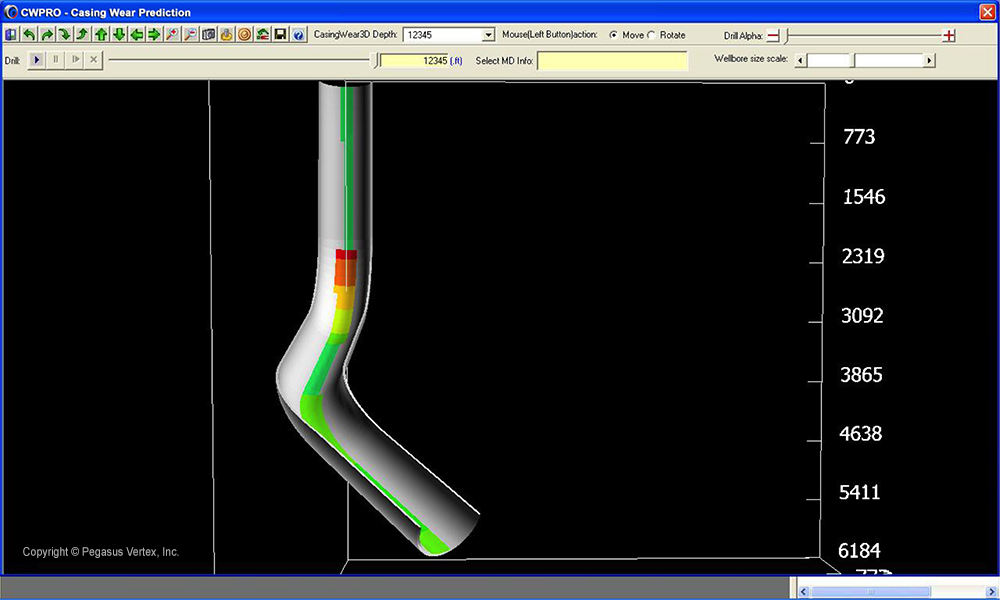
Computer casing wear modeling reduces risks and can identify potential problems prior to its occurring. Necessary modifications on casing designs and drilling parameters could be made before the pumping starts once we can predict the location and magnitude of wear.

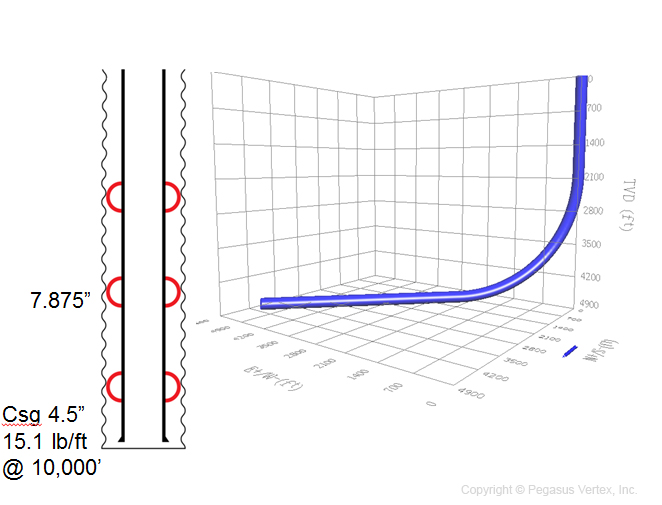
Figure 1 shows the 3D visualization of magnitude and location of wear in a previously set casing.

Figure 1. 3D Visualization of Casing Wear

The knowledge we have acquired through decades of studies, lab testing, post-job analyses and computer modeling provides a good foundation for the following casing wear preventive measures:

  • Minimize dogleg severity and expect real dogleg at least 1.5 times higher than the planned value.
  • Use casing friendly tool joint materials.
  • Reduce rotor speed and use downhole motor.
  • Increase ROP.
  • Select proper mud type and add lubricants to reduce wear and friction.
  • Use drill pipe protectors.
  • Use thick wall casing in the anticipated wear section area.
  • Use software to reduce risks.

Please go to www.pvisoftware.com/white-paper/Casing-Wear-Causes-Prediction-and-Prevention.pdf to download the complete Casing Wear white paper.

Casing Wear Series – 2: Prediction

1. Wear Mechanism

The casing wear model applied in CWPRO (casing wear prediction software developed by PVI) assumes that the metal volume worn away in a wear groove section is proportional to the frictional energy transmitted to the casing by a rotating tool joint as shown in Figure 2 in the Casing Wear Series – 1: Causes.

transmitted-frictional-energy-formula-1

The transmitted frictional energy is defined in this formula:

Where:

E  = Frictional Energy, lb-ft

μ  = Friction factor, dimensionless

SF= Side force on tool joint per foot, lbf/ft

SD = Sliding distance traveled by the tool joint against casing wall, in

The volume of casing wall removed per foot in time t hours is mathematically expressed in the equation:

equation-The--volume-of-casing-wall-removed-per-foot-in-time-t-hours

Where:

WV = Casing wear volume per foot, in3/ft

WF = Wear factor, E-10psi

SFdp = Side force on drill pipe per foot, lbf/ft

Dtj = Tool joint OD, in

N = Rotary speed, rpm

t = Rotating time, hr

The definition of wear factor is the ratio of friction factor to specific energy, which is the amount of energy required to remove a unit of steel. The unit for wear factor is E-10psi-1; therefore, when a wear factor is reported as 8, the actual value used in casing wear calculation is 8E-10psi-1.

Quite a few experiments were conducted to find the casing wear factors under different mud systems, tool joint materials, casing interior and drill string protectors. Among them, Maurer Engineering Inc. conducted joint-industry project DEA-42. It was reported that more than 300 laboratory tests were performed under DEA-42 to determine the wear factors for various drilling conditions.

For a typical water-based mud, WF can vary as follows:

Normal or low: 3 – 7

Medium: 8 – 13

High: 14 – 20

WF above 20 can be considered as very high and may cause severe casing damage.

2. Wear Geometry

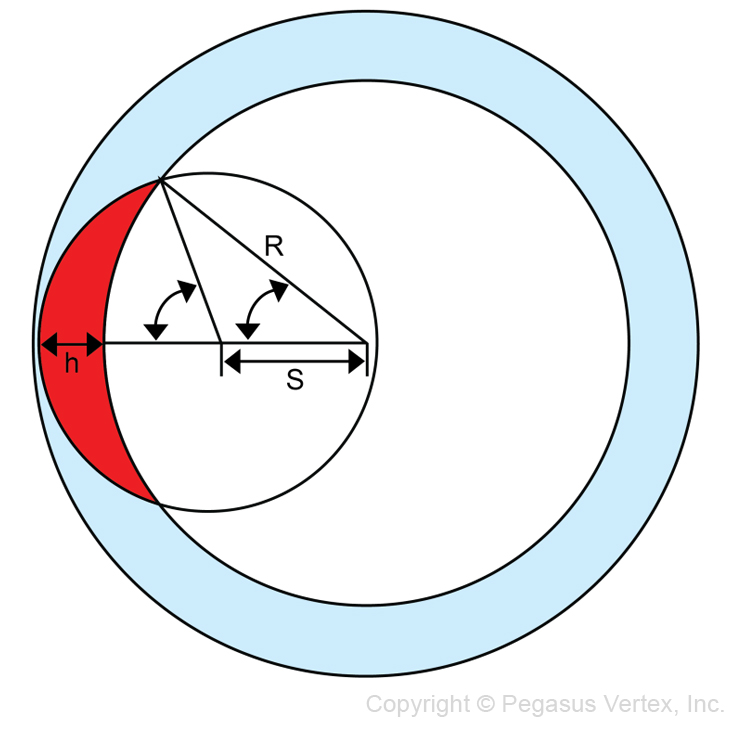
A typical wear groove is shown in the following figure.

Figure 1. Casing Wear Groove | PVI drilling software

Figure 1. Casing Wear Groove

The relationship between wear depth and casing wear volume is:

equation-relationship-between-wear-depth-and-casing-wear-volume

Where:

WV = casing wear volume per foot, in3/ft

h = wear depth, in

r = tool joint outer radius, in

R = casing inner radius, in

S = R - (r - h), in

P = (R + r + S) / 2, in

equation-relationship-between-wear-depth-and-casing-wear-volume-cos

3. Software

Based on the R & D results from the past two decades, PVI developed CWPRO, software that enables us to understand the casing wear phenomenon and accurately predict casing wear before the drilling operation or perform a post-drilling analysis.

CWPRO is a comprehensive casing wear prediction software with built-in torque and drag function. For every incremental drilling interval, the amount of energy transferred from drill pipe to casing is calculated. Accumulative wear and wear depth are first obtained and then the burst and collapse strength of the worn casing can be assessed.

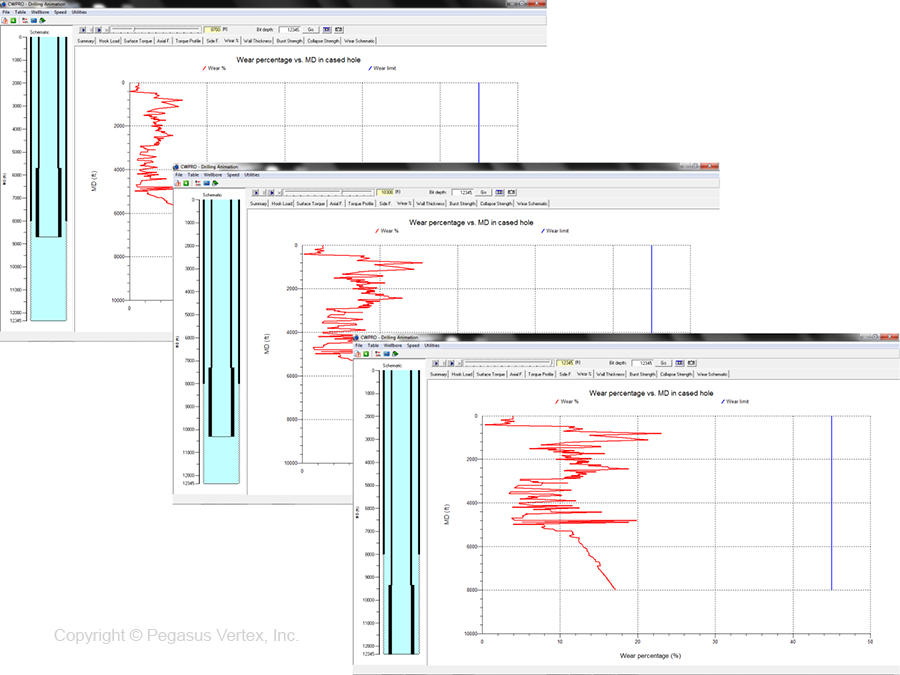
Being a time-dependent incident, casing wear deepens as we drill deeper. Figure 2 shows the sequence of drilling and corresponding wear profile along the previously set casing.

Figure 2. Time-dependent Casing Wear | PVI drilling software

Figure 2. Time-dependent Casing Wear

Casing Wear Series – 1: Causes

During the drilling phase, the most costly component is the casing. On top of the expensive casing materials and the costs likely to be encountered in cutting, pulling and replacing a worn or damaged string, casing wear creates more serious problems for operators due to its potential catastrophic incidents such as oil spills, blow outs or loss of the well.

To analyze the forces behind casing wear, we need to study the torque and drag (T&D) of the drill pipe during drilling operations. The basic mathematical and physical model of T&D has not changed significantly since Johancsik et al. published their paper on T&D prediction. Pipe movements such as drilling ahead or tripping create drag, while rotation produces torque. The magnitude of T&D is determined by the combination of these two movements.

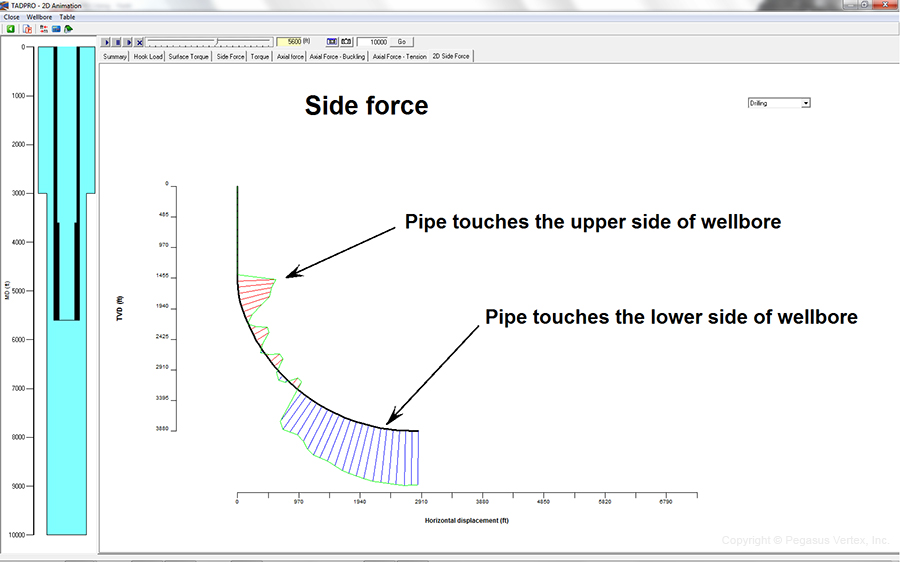
Since the so-called vertical well virtually does not exist (the whirring action of the bit always creates a micro-helical shape of the well path), the contact of the drill pipe and its tool joint with the casing ID is unavoidable. The gravitational force acting on the drill pipe is always trying to pull the pipe to the lower side of the wellbore, while the axial tension on the drill pipe (in a build-up section) tends to push the pipe to the upper side of the wellbore. Depending on the pipe weight, dogleg severity, and axial force along the pipe, the drill pipe either touches the upper or lower side of the wellbore.

Typical T&D analysis starts by dividing the pipe into small elements. Calculation begins from the bottom element of the pipe, where weight on bit (WOB) and torque on bit (TOB) are expected. For each element, force and torque are balanced and the T&D at the top of the element are calculated. From bottom to top, calculations are performed for each pipe element, until it reaches the rig floor. This step-by-step calculation also determines the direction and magnitude of the side force, which pushes the drill pipe against the wellbore as shown in Figure 1.

Figure 1. Snapshot of Side Force along a Drill Pipe

Figure 1. Snapshot of Side Force along a Drill Pipe

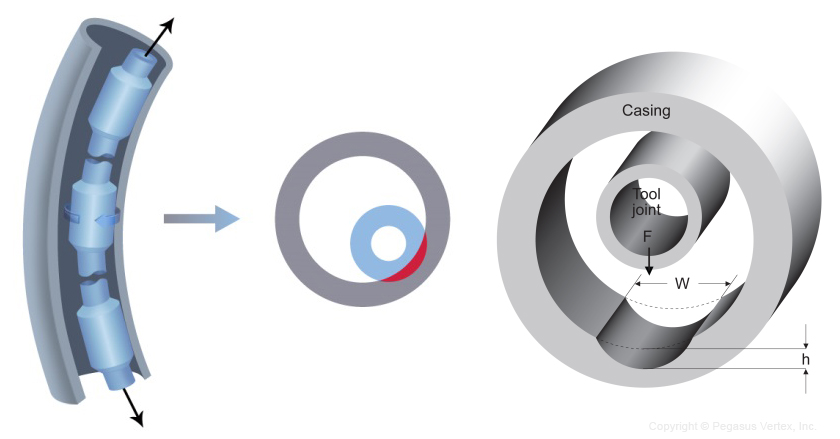
Under this side force, the rotating tool joint on the drill pipe against the casing inside, gradually removes steel from the casing wall and forms a crescent-shaped wear on the casing as shown in Figure 2.

Figure 2. Rotating Tool Joint Wears Crescent Grooves in Casing

Figure 2. Rotating Tool Joint Wears Crescent Grooves in Casing

The seriousness of friction between two contacting surfaces is dependent on the nature of the rubbing surfaces and the mud.

The tool joint coating plays a bigger role here compared to the casing wall. The industry has seen tool joint coating evolve from “casing killer” (rough tungsten carbide) to “casing friendly” as shown by many high-tech hardbanding materials.

Tungsten carbide is applied on the tool joint. While it is a very good protector of the tool joints, it aggressively wears the casing so much that the mud type and its additive will not help much in reducing casing wear if rough tungsten carbide is present.

Once a casing friendly tool joint coating has been selected, the mud type and its additives play an intermediate role in casing wear. Water-based mud causes twice as much casing wear as the oil-based alternative. Lubricant reduces friction and severity of the wear.

Generally speaking, high dogleg will create a high side force and severe casing wear. The wear profile resembles the shape of dogleg severity. Higher RPM and lower ROP make more rotation time between the tool joint and casing and will cause aggressive wear.

The following conditions contribute to casing wear:

  • Well path and dogleg
  • Drill pipe weight
  • Tool joint coating
  • Mud and additives
  • RPM and ROP

Change and its Effects

“Change is a weapon whose effects depend on who holds it in his hand and at whom it is aimed” - Anonymous

With that being said, how can we relate that quote to what we are going to talk about in this article?

Well, changing the mode of a well causes changes in temperature and pressure inside and outside the tubing. This can create length and force changes in the tubing string that can potentially affect the packer and downhole tools. Once the packer is installed and the tubing landed, any operational mode change will cause a change in the length or force in the tubing string.

The length and force changes can be considerable and can cause enormous stresses on the tubing string, as well as on the packer under certain conditions. The net result could reduce the effectiveness of the downhole tools and damage the tubing, casing, or even the formations accessible to the well. Failure to consider length and force changes may result in costly failures during the operations.

There are four factors that tend to cause a change in the length or force in the tubing string:

  1. Piston effect: caused by a change in the pressure in the tubing or annulus above the packer on a specific affected area
  2. Ballooning effect: caused by a change in the average pressure inside or outside the tubing string
  3. Buckling effect, caused when internal tubing pressure is higher than the annulus pressure.
  4. Temperature effect: caused by a change in the average temperature of the string

Piston Effect

The length change or force induced by the piston effect is caused by pressure changes inside the annulus and tubing at the packer. It is possible to get rid of the forces generated on the tubing string by the piston effect by anchoring the seals in the packer bore. All the forces are now being absorbed or contained completely within the packer.

Ballooning Effect

The ballooning effect is caused by the change in average pressure inside or outside the tubing string. Internal pressure balloons the tubing and causes it to shorten. Likewise, pressure in the annulus squeezes the tubing, causing it to elongate. This effect is called "reverse ballooning."

Buckling Effects

Tubing strings tend to buckle only when the internal tubing pressure (pi) is greater than the annulus pressure. The result is always a shortening of the tubing string, but the actual force exerted is negligible. The diminishing in length occurs because of the tubing string being in a spiral shape rather than straight.

Temperature Effect

Thermal expansion or contraction causes the major length change in the tubing. Heated metal expands, and cooled metal contracts. In a long string of tubing with a temperature change over its entire length, if tubing movement is constrained, forces will be introduced as a result of the temperature change.

The direction of the length change for each effect must be considered when summing them. It follows that for a change in the conditions; the movement created by one effect can be offset or enhanced by the movement developed by another effect.

For these scenarios, PVI has developed TMPRO.

TMPRO-tubing movement | PVI drilling software

Among its many features it includes:

  • 3 packer types (free, limited and anchored)
  • Piston, buckling, ballooning and temperature effects
  • Pipe database
  • Different tubing materials
  • Initial and final fluid configurations
  • Tensile and stress strengths
  • Burst and collapse strengths
  • Operation designs

TMPRO is based on the theory developed by Lubinski and Hammerlindi and it’s a great tool to avoid any tubing or packer problems allowing its users to make the right change to have the right effects.

Casing Centralizer Series – 5: Are We Using Too Many or Too Few?

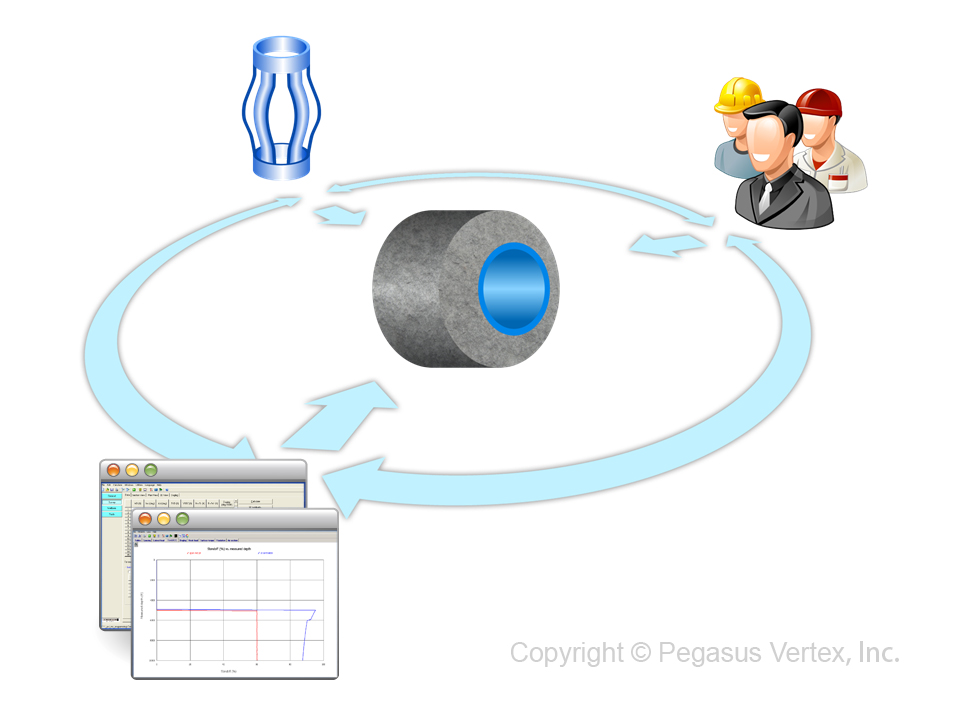
Our industry is blessed with many talented and experienced engineers. We also have centralizer vendors producing the very best and top quality products. It is critical that we maximize the engineering potential while selecting the proper types of centralizers and placements. A software package like CentraDesign should be an integral part of the total approach of the centralizer placement optimization.

Theories and equations determining the casing deflection between centralizers are well established, even though a hand calculation for a deviated well is impractical.

Experience plus software technology enable both centralizer vendors and operators to conduct centralizer optimization prior to field execution.

Fig. 1. Total Approach of Centralizer Placement

Fig. 1. Total Approach of Centralizer Placement

When optimizing the centralizer placement, consider the following:

  • Each well is different. Our previous experience may not apply to the next well.
  • Operators aim to obtain a satisfactory standoff with less centralizers.
  • Similarly centralizer vendors aim to obtain a satisfactory standoff to sell more units.
  • Software like CentraDesign optimizes the centralizer placement and usage.
  • Computer modeling reduces risks and costs.

Centralizer placement can make or break a good cementing job. Computer modeling is not only an easy but also a necessary step to achieve optimization of centralizer usage.  So, if you ask me the question: “Are we using too many or too few centralizers?” I would say: “If we all use readily available software to check the standoff profile for a specified spacing and optimize the placement, then we would probably use the correct number of centralizers.”

Casing Centralizer Series – 4: Case Study

With the help of computer modeling, centralizer placement optimization becomes easy to perform for all types of wells. Ideally, this kind of optimization should be done before every casing job. Here is an example of centralizer placement optimization using the CentraDesign software.

Fig. 1. Example Well

Fig. 1. Example Well

The example well has a kick-off point at 2,000 ft. The previous casing (ID = 8.535”) was set at the same depth. Our goal is to centralize the 12,345 ft of 4 1/2” casing, deviated from 0o to 90o. The centralizer considered is the bow spring type with a restoring force of 800 lbf.

One approach to centralizer placement optimization is to specify the spacing using our experience and knowledge, and then let the software check if it yields a satisfactory standoff profile. We compare 2 cases: one with 40 ft (1 centralizer per joint) and the other with 20 ft (2 centralizers per joint) for the centralizer spacing. Fig. 2 shows the resulting standoff profiles. The blue line is the standoff at the centralizer, while the red line is the standoff at the middle point between centralizers, which is always lower than that of at centralizers. Since we are using the bow spring centralizers, the standoff at the middle point between centralizers is the summation of the casing sagging between centralizers and the bow spring compression at the centralizers.

Fig. 2. Standoff Profiles

Fig. 2. Standoff Profiles

For centralizer spacing of 40 ft, the number of centralizers required is 251.  From 2,000ft to 7,000 ft (deviation from 0o to 30o), the standoff is between 100% and 70%, which meets the minimum industry standard of 67%. From 7,000ft to 12,345 ft (deviation from 30o to 90o), the standoff drops from 70% to 20%, which is problematic: poor standoff profile at this section may cause potential cementing problems.

The natural way to solve this problem is to try 2 centralizers per joint (spacing of 20 ft).  The new standoff profile is much better than the normal industry standard, but with the doubled number of centralizers, this new approach may be too conservative, leaving engineers wondering: am I using too many centralizers?

Alternatively, we can specify the required standoff and let the software tell us how to space each centralizer. With the required 70% standoff throughout a 4 1/2” casing, CentraDesign displays the spacing necessary to achieve the specified standoff, as shown in the following figures. The total number of centralizers used is 200, a significant reduction from previous approaches.

Fig. 3. Calculated Spacing Required to Achieve 70% Standoff

Fig. 3. Calculated Spacing Required to Achieve 70% Standoff

Logically, as the well builds up from a 0o to 90o inclination angle, centralizer spacing decreases: casing needs more support in the deviated or horizontal sections. More advanced approach is to combine the “Specify spacing” and “Specify standoff” modes to yield the simple-to-install centralizer placement, yet satisfying standoff profile, by using incremental spacing options. Optimized centralizer placing not only produces good standoff, but also increases the efficiency of field installation of centralizers and avoids the excessive use of unnecessary centralizers.

Casing Centralizer Series – 3: Modeling

We are going to study on the 5 parameters affecting casing standoff.

1. Well trajectory

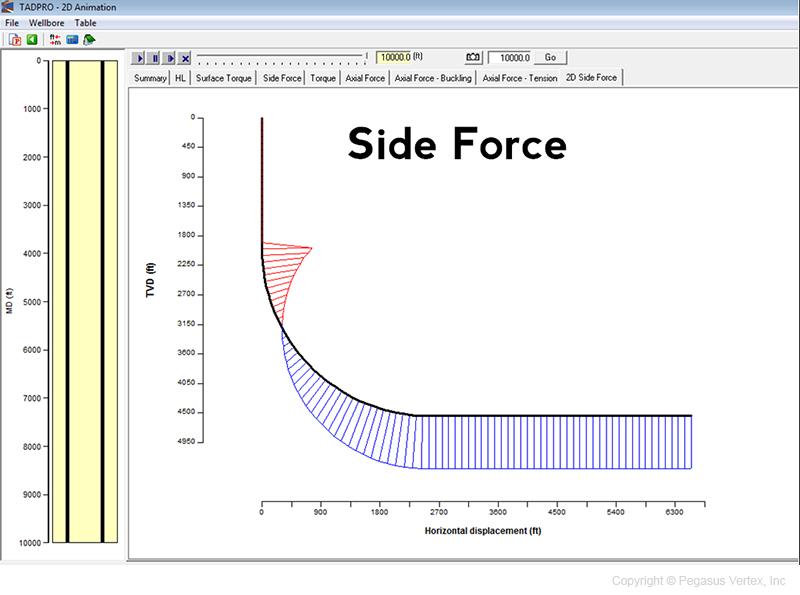
Well trajectory is expressed in terms of survey data, consisting measured depth, inclination and azimuth angles. It defines the shape of the well path and thus has great impact on the direction and magnitude of the side forces that pull the casing string to the wellbore. Fig. 5 shows the magnitude and direction of the side force distribution on a casing in a horizontal well.

Fig. 1. Side Force Profile

Fig. 1. Side Force Profile

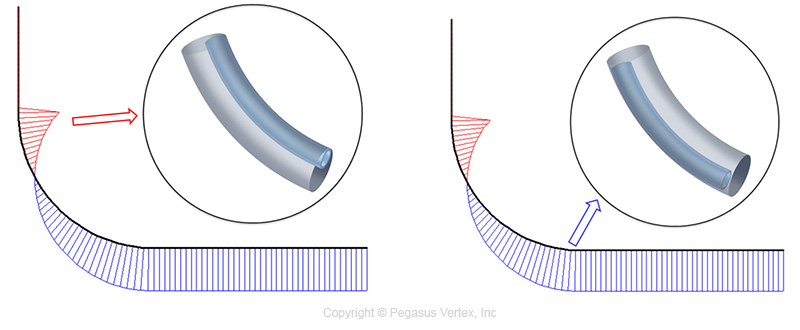
For a casing section in a build-up or horizontal section of wellbore, the weight of pipe pulls the casing toward to the lower side of hole. The blue lines indicate that the casing touches the lower side of wellbore. The upper section of the casing string has to sustain the weight of lower casing sections. This creates tension force along the casing string.  Wellbore doglegs cause the resultant force to pull the casing toward the upper side of the hole, as indicated by the red lines. Therefore, casing string in a deviated or horizontal well always touches the wellbore, upper or lower side.

Fig. 2. Side Forces with Casing Positions

Fig. 2. Side Forces with Casing Positions

Generally speaking, horizontal or extended reach wells require more support from centralizers to maintain a good standoff profile.

2. Casing size and weight

Casing weight determines the gravitational force which pulls the pipe toward the lower side of the borehole. The heavier the casing string is, more or stronger centralizers are required.

3. Fluids inside casing and in annulus

The buoyancy force calculation is further complicated by the multi-fluid configuration during a cementing job. When heavy cement slurries are inside the casing and light drilling mud in the annulus, the effective weight of casing is at its greatest. On the other hand, when cement slurries are in place and displacement fluid inside the casing, the buoyancy is at its peak and the effective weight of the pipe is the least.

When we design the centralizer placement for the scenario of cement slurries in place, it favors us to have less effective casing weight, pulling the casing string downward; but when the cement slurries are inside the casing during the displacement, the lower standoff could cause mud channeling problems. It is better to study standoff for all the situations.

4. Centralizer properties

Not all centralizers are created equal.  Centralizer manufacturers are striving to improve the performances of their products.

For solid centralizers including mold-on type, the blade OD is the key parameter as far as the casing centralization is concerned.

For bow-spring centralizers, the restoring force is the measurement of the strength of a centralizer. It is defined as the side force to deflect the bow by 1/3 or its original height.

5. Centralizer placement

Once the well is planned, casing designed, cementing procedure prepared and centralizer type selected, we do not have many options other than placing the centralizers strategically to achieve the desired standoff. However, this is also a great leverage.

Poor spacing will result in poor standoff even with the best centralizers in the market.

Casing Centralizer Series – 2: Standoff

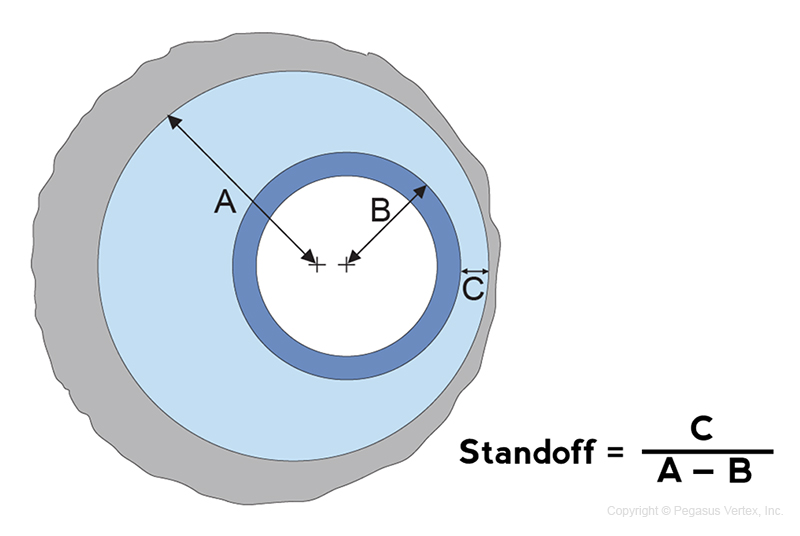
The term standoff (SO) describes the extent to which the pipe is centered (Fig. 1).

Fig. 1. Definition of standoff

Fig. 1. Definition of standoff

If a casing is perfectly centered, the standoff is 100%. A standoff of 0% means that the pipe touches the wellbore.  Regardless of the centralizer type, the goal is to provide a positive standoff, preferably above 67%, throughout the casing string.

The casing deflection between centralizers obeys the laws of physics. An engineering analysis can help both operators and service companies arrive at the optimized number and placement of centralizers for a particular well.

The casing standoff depends on the following factors:

  • Well path and hole size
  • Casing OD and weight
  • Centralizer properties
  • Position and densities of mud and cement slurries (buoyance)

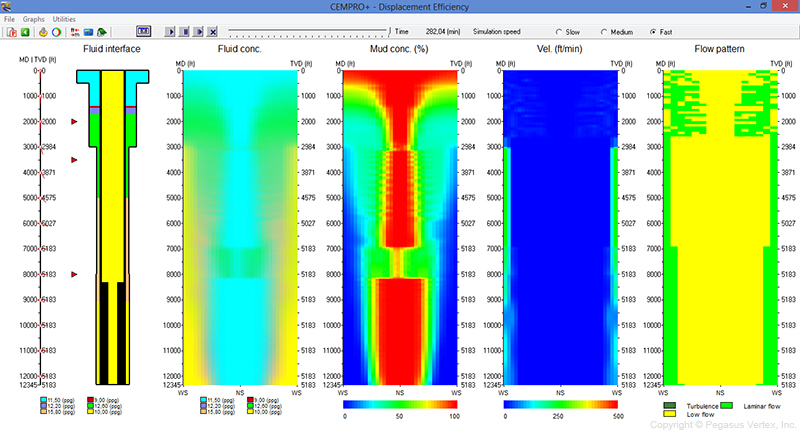
Incomplete mud removal causes poor cement seal and non-productive time.  A good casing standoff helps reduce the mud channeling and improves the displacement efficiency. The following 2 pictures illustrate the impact of casing standoff on displacement efficiency.  The 3rd track in Figure 3 shows the mud concentration in the annulus after a cementing job with 0% casing standoff.

Fig. 2. Displacement Efficiency for Casing Standoff of 0%

Fig. 2. Displacement Efficiency for Casing Standoff of 0%

You can see that there are some large red areas, which represent the high percentage of the remaining mud, in the narrow side (NS) of an eccentric annulus.

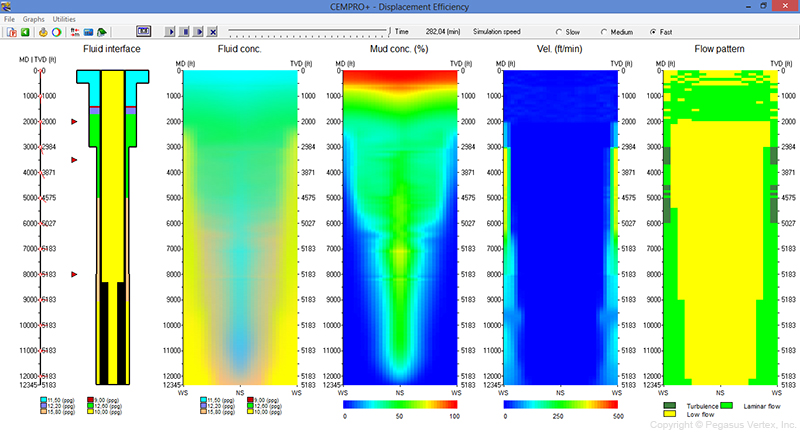
We kept everything else the same and only changed the casing standoff to 70%.  Now the displacement efficiency improved significantly, as shown in the following picture.

Fig. 3. Displacement Efficiency for Casing Standoff of 70%

Fig. 3. Displacement Efficiency for Casing Standoff of 70%

Casing Centralizer Series – 1: Types of Centralizers

Casing centralizer is a mechanical device secured around the casing at various locations to keep the casing from contacting the wellbore walls. As a result of casing centralization, a continuous annular clearance around the casing allows cement to completely seal the casing to the borehole wall.

Casing centralization is one of the key elements to ensure the quality of a cementing job by preventing mud channeling and poor zonal isolation. Centralizers can also assist in the running of the casing and the prevention of differential sticking.

Centralizer’s usage is extensive! It is estimated that 10 million centralizers are manufactured and used every year globally. Centralizer manufacturers likely want to increase the demand for centralizers. However, operators on the other hand, may wonder: “Should we use that many?”

While centralizers are used extensively, wellbore problems continue to arise due to poor cementing jobs. Centralizer properties and placements directly or indirectly affect the quality of the cementing job.

The challenge that both operators and service companies face is to choose the right type of centralizers and place the right amount at the optimum positions on the casing to achieve a good standoff profile.

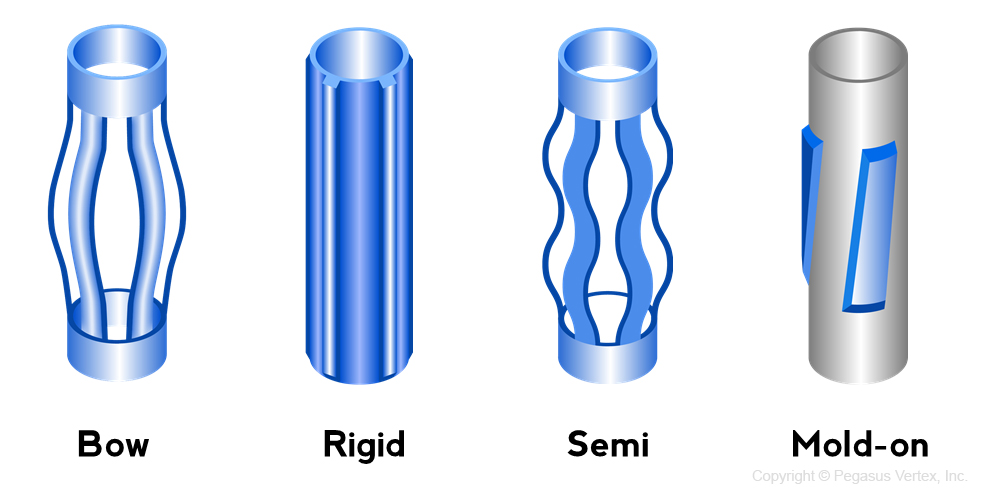
There are 4 types of centralizers (Fig. 1): bow-spring, rigid, semi-rigid, and mold-on; each with its own pros and cons.

Types of Centralizers | Illustration from Pegasus Vertex, Inc. - Drilling Software

Fig. 1. Types of centralizers

1. Bow-Spring

Since the bow springs are slightly larger than the wellbore, they can provide complete centralization in vertical or slightly deviated wells. Due to the flexibility of bows, they can pass through narrow hole sections and expand in the targeted locations.

The shape and stiffness of the bows determine the restoring force, which is defined as the resistance force when a bow is compressed by 1/3 of its uncompressed height. The effectiveness of this type of centralizer is heavily dependent on the restoring force.

When the casing is heavy and/or the wellbore is highly deviated, they may not support the casing very well. For example, on a riser tieback casing string, a helically buckled casing could create a side force of 50,000 to 100,000 lbf (222 to 445 kN), well beyond the capabilities of the spring-bow centralizer. A solid centralizer would be able to meet the requirements.

2. Rigid

Rigid centralizers are built out of solid steel bars or cast iron, with a fixed blade height and are sized to fit a specific casing or hole size. This type is rugged and works well even in deviated wellbores, regardless of the side force. They provide a guaranteed standoff and function as bearings during the pipe rotation, but since the centralizers are smaller than the wellbore, they will not provide a good centralization as the bow-spring type centralizers in vertical wells.

3. Semi-Rigid

Semi-rigid centralizers are made of double crested bows, which provide desirable features found in both the bow-spring and the rigid centralizers. The spring characteristic of the bows allows the semi-rigid centralizers to compress in order to get through tight spots and severe doglegs. The double-crested bow provides restoring forces that exceed those standards set forth in the API specifications and therefore exhibits certain features normally associated with rigid centralizers.

4. Mold-On
The mold-on centralizer blades, made of carbon fiber ceramic materials, can be applied directly to the casing surface. The blade length, angle and spacing can be designed to fit specific well applications, especially for the close tolerance annulus. The non-metallic composite can also reduce the friction in extended reach laterals to prevent casing buckling.